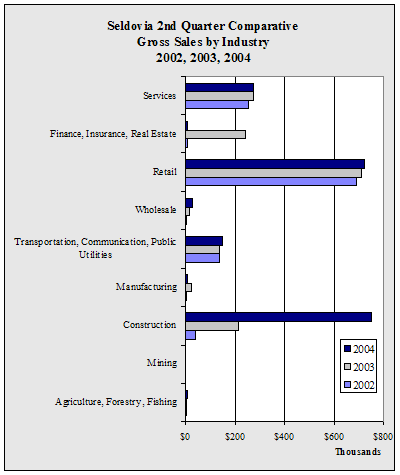
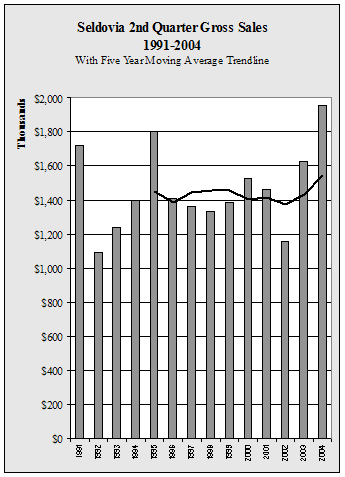
| Seldovia
2nd Quarter Gross Sales by Industry - 1998-2004 - in $ |
| |
1998 |
1999 |
2000 |
2001 |
2002 |
2003 |
2004 |
Annual
Change |
| Agriculture,
Forestry, Fishing |
3,422 |
2,605 |
2,797 |
3,707 |
6,306 |
5,737 |
11,260 |
96.3% |
| Mining |
0 |
0 |
0 |
0 |
0 |
0 |
0 |
NA
|
| Construction |
23,892 |
33,314 |
248,864 |
287,028 |
42,719 |
213,775 |
753,705 |
252.6% |
| Manufacturing |
20,301 |
8,667 |
6,644 |
14,430 |
5,911 |
25,326 |
9,225 |
-63.6% |
| Transportation,
Communication, Public Utilities |
162,822 |
183,025 |
163,062 |
138,629 |
136,379 |
135,580 |
152,078 |
12.2% |
| Wholesale |
269,116 |
82,638 |
22,656 |
13,490 |
7,040 |
17,477 |
26,237 |
50.1% |
| Retail |
493,154 |
727,459 |
752,524 |
749,278 |
689,758 |
710,330 |
721,834 |
1.6% |
| Finance,
Insurance, Real Estate |
43,107 |
32,952 |
24,750 |
17,006 |
8,734 |
242,188 |
9,670 |
-96.0% |
| Services |
315,349 |
317,528 |
305,603 |
240,048 |
257,751 |
278,014 |
273,694 |
-1.6% |
| Total |
1,331,163 |
1,388,188 |
1,526,900 |
1,463,616 |
1,154,598 |
1,628,427 |
1,957,703 |
20.2% |
| Annual
Change |
|
4.3% |
10.0% |
-4.1% |
-21.1% |
41.0% |
20.2% |
|
|


