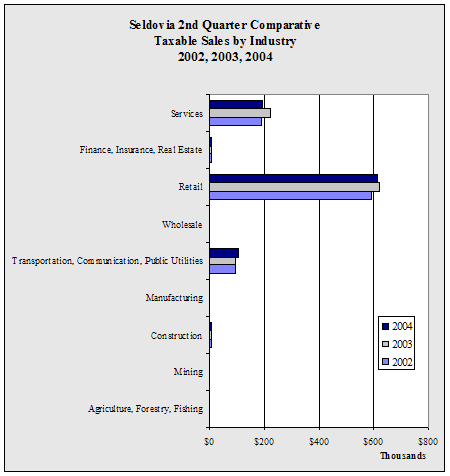
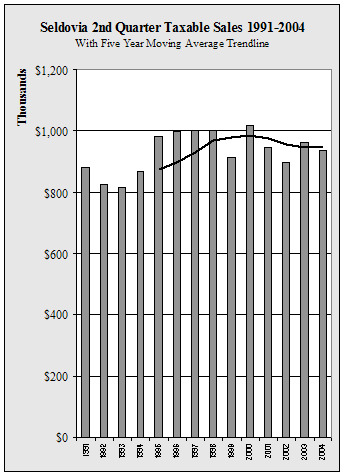
| Seldovia
2nd Quarter Taxable Sales by Industry - 1998-2004 - in $ |
| |
1998 |
1999 |
2000 |
2001 |
2002 |
2003 |
2004 |
Annual
Change |
| Agriculture,
Forestry, Fishing |
3,422 |
2,605 |
2,771 |
3,616 |
3,551 |
2,970 |
3,140 |
NA |
| Mining |
0 |
0 |
0 |
0 |
0 |
0 |
0 |
NA |
| Construction |
9,085 |
9,564 |
11,054 |
9,498 |
9,130 |
9,946 |
7,558 |
-24.0% |
| Manufacturing |
3,816 |
2,478 |
867 |
1,243 |
1,806 |
1,749 |
2,625 |
50.1% |
| Transportation,
Communication, Public Utilities |
109,994 |
119,047 |
118,630 |
94,825 |
95,299 |
96,701 |
105,084 |
8.7% |
| Wholesale |
143,631 |
2,714 |
2,227 |
1,305 |
135 |
321 |
137 |
-57.3% |
| Retail |
457,754 |
543,204 |
631,517 |
647,457 |
590,349 |
620,851 |
613,678 |
-1.2% |
| Finance,
Insurance, Real Estate |
23,702 |
17,095 |
8,996 |
7,434 |
6,144 |
9,430 |
8,040 |
-14.7% |
| Services |
249,545 |
219,255 |
242,193 |
180,966 |
192,416 |
220,998 |
195,960 |
-11.3% |
| Total |
1,000,949 |
915,962 |
1,018,255 |
946,344 |
898,830 |
962,966 |
936,222 |
-2.8% |
| Annual
Change |
|
-8.5% |
11.2% |
-7.1% |
-5.0% |
7.1% |
-2.8% |
|
|


