| Seldovia
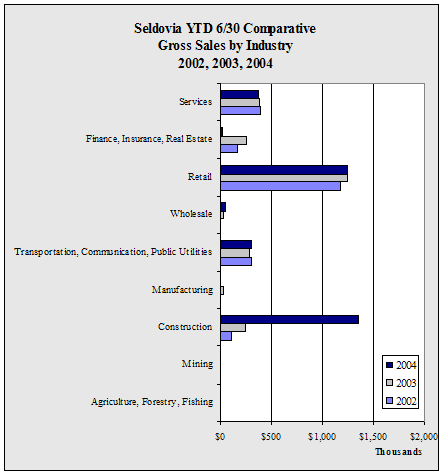
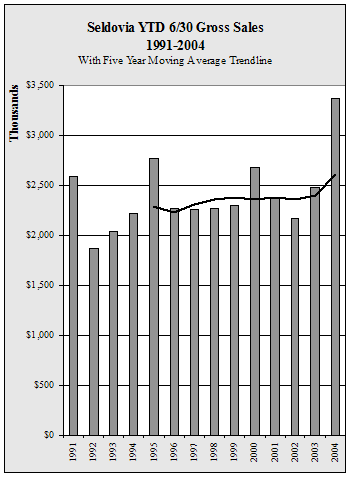
YTD 6/30 Gross Sales by Industry - 1998-2004 - in $ |
| |
1998 |
1999 |
2000 |
2001 |
2002 |
2003 |
2004 |
Annual
Change |
| Agriculture,
Forestry, Fishing |
3,422 |
2,605 |
2,797 |
3,707 |
6,306 |
5,737 |
11,260 |
96.3% |
| Mining |
0 |
0 |
0 |
0 |
0 |
0 |
0 |
NA
|
| Construction |
208,439 |
45,575 |
295,708 |
317,051 |
109,501 |
241,722 |
1,355,081 |
460.6% |
| Manufacturing |
24,191 |
11,894 |
10,373 |
17,419 |
7,615 |
27,171 |
10,474 |
-61.5% |
| Transportation,
Communication, Public Utilities |
319,863 |
371,098 |
322,429 |
300,653 |
299,624 |
283,329 |
303,826 |
7.2% |
| Wholesale |
478,706 |
337,175 |
39,417 |
39,176 |
10,800 |
26,678 |
40,387 |
51.4% |
| Retail |
756,625 |
1,039,762 |
1,560,185 |
1,302,674 |
1,175,237 |
1,253,841 |
1,244,403 |
-0.8% |
| Finance,
Insurance, Real Estate |
71,034 |
71,069 |
38,813 |
40,830 |
167,402 |
249,278 |
18,797 |
-92.5% |
| Services |
404,557 |
417,068 |
407,870 |
340,917 |
389,825 |
386,867 |
378,454 |
-2.2% |
| Total |
2,266,837 |
2,296,246 |
2,677,592 |
2,362,427 |
2,166,310 |
2,474,623 |
3,362,682 |
35.9% |
| Annual
Change |
|
1.3% |
16.6% |
-11.8% |
-8.3% |
14.2% |
35.9% |
|
|


