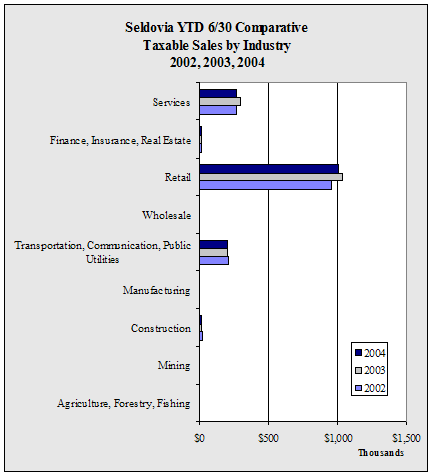
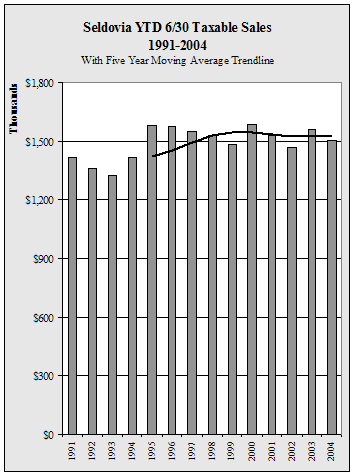
| Seldovia
YTD 6/30 Taxable Sales by Industry - 1998-2004 - in $ |
| |
1998 |
1999 |
2000 |
2001 |
2002 |
2003 |
2004 |
Annual
Change |
| Agriculture,
Forestry, Fishing |
3,422 |
2,605 |
2,771 |
3,616 |
3,551 |
2,970 |
3,140 |
5.7% |
| Mining |
0 |
0 |
0 |
0 |
0 |
0 |
0 |
NA
|
| Construction |
10,738 |
13,925 |
21,043 |
17,093 |
16,110 |
11,077 |
12,718 |
14.8% |
| Manufacturing |
5,459 |
3,556 |
2,576 |
2,297 |
3,000 |
2,117 |
3,274 |
54.7% |
| Transportation,
Communication, Public Utilities |
211,185 |
232,079 |
228,935 |
212,013 |
210,320 |
200,393 |
202,073 |
0.8% |
| Wholesale |
247,215 |
100,549 |
3,230 |
1,555 |
294 |
471 |
167 |
-64.5% |
| Retail |
702,017 |
818,999 |
1,001,378 |
1,039,506 |
957,765 |
1,035,907 |
1,006,873 |
-2.8% |
| Finance,
Insurance, Real Estate |
41,187 |
35,132 |
17,589 |
13,823 |
13,322 |
14,030 |
13,982 |
-0.3% |
| Services |
309,386 |
278,555 |
309,826 |
239,996 |
268,092 |
294,971 |
261,675 |
-11.3% |
| Total |
1,530,609 |
1,485,400 |
1,587,348 |
1,529,899 |
1,472,454 |
1,561,936 |
1,503,902 |
-3.7% |
| Annual
Change |
|
-3.0% |
6.9% |
-3.6% |
-3.8% |
6.1% |
-3.7% |
|
|


