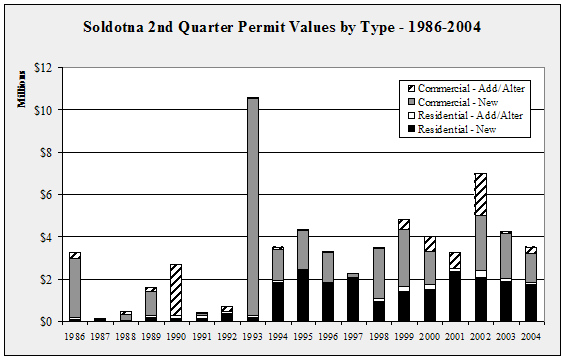
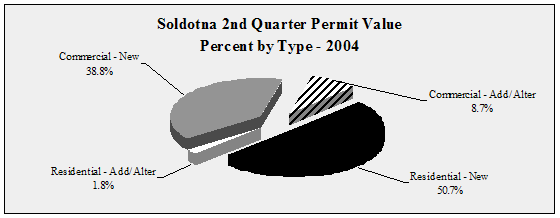
| Soldotna
2nd Quarter Permit Values by Type - 1998-2004 - in $ |
| |
1998 |
1999 |
2000 |
2001 |
2002 |
2003 |
2004 |
Annual
Change |
| Residential
- New |
965,000 |
1,453,674 |
1,520,491 |
2,363,001 |
2,075,293 |
1,899,354 |
1,777,087 |
-6.4% |
| Residential
- Add/Alter |
122,000 |
181,361 |
224,674 |
151,039 |
339,286 |
130,080 |
64,092 |
-50.7% |
| Commercial
- New |
2,333,400 |
2,723,818 |
1,583,642 |
0 |
2,601,575 |
2,116,490 |
1,359,597 |
-35.8% |
| Commercial
- Add/Alter |
73,000 |
426,199 |
680,549 |
717,150 |
1,987,304 |
88,000 |
304,800 |
246.4% |
| TOTAL |
3,493,400 |
4,785,052 |
4,009,356 |
3,231,190 |
7,003,458 |
4,233,924 |
3,505,576 |
-17.2% |
| Annual
Change |
|
37.0% |
-16.2% |
-19.4% |
116.7% |
-39.5% |
-17.2% |
|
|


