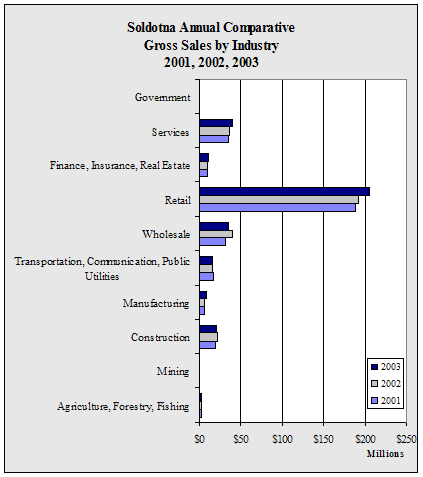
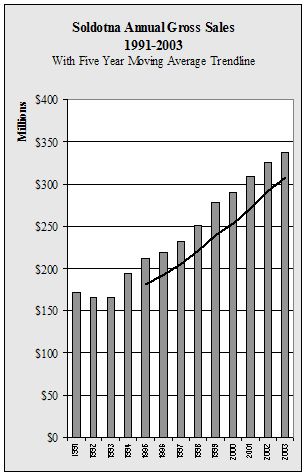
| Soldotna
Annual Gross Sales by Industry - 1997-2003 - in $ |
| |
1997 |
1998 |
1999 |
2000 |
2001 |
2002 |
2003 |
Annual
Change |
| Agriculture,
Forestry, Fishing |
787,505 |
689,389 |
954,143 |
1,727,448 |
1,664,917 |
1,853,591 |
2,523,473 |
36.1% |
| Mining |
645,979 |
2,729,541 |
306,689 |
305,525 |
305,091 |
410,684 |
450,504 |
9.7% |
| Construction |
20,624,014 |
20,205,240 |
17,075,443 |
20,761,485 |
19,395,458 |
22,462,842 |
20,789,343 |
-7.5% |
| Manufacturing |
2,824,914 |
3,192,979 |
3,210,218 |
5,446,988 |
5,938,040 |
6,301,658 |
7,729,281 |
22.7% |
| Transportation,
Communication, Public Utilities |
13,396,265 |
14,308,591 |
17,467,668 |
15,708,998 |
17,799,215 |
15,900,605 |
16,342,600 |
2.8% |
| Wholesale |
11,054,736 |
14,626,150 |
32,515,047 |
32,610,279 |
31,467,653 |
40,201,769 |
34,368,869 |
-14.5% |
| Retail |
149,103,119 |
157,774,054 |
166,898,488 |
170,201,586 |
187,606,859 |
191,902,954 |
204,650,808 |
6.6% |
| Finance,
Insurance, Real Estate |
7,603,912 |
7,365,455 |
8,509,983 |
10,210,170 |
10,232,574 |
10,465,959 |
10,733,557 |
2.6% |
| Services |
26,507,740 |
29,884,044 |
30,622,659 |
32,265,770 |
34,683,298 |
36,320,220 |
39,994,423 |
10.1% |
| Government |
35,704 |
18,221 |
28,399 |
17,062 |
19,103 |
22,579 |
41,717 |
84.8% |
| Total |
232,583,888 |
250,793,664 |
277,588,737 |
289,255,311 |
309,112,208 |
325,842,861 |
337,624,575 |
3.6% |
| Annual
Change |
|
7.8% |
10.7% |
4.2% |
6.9% |
5.4% |
3.6% |
|
|


