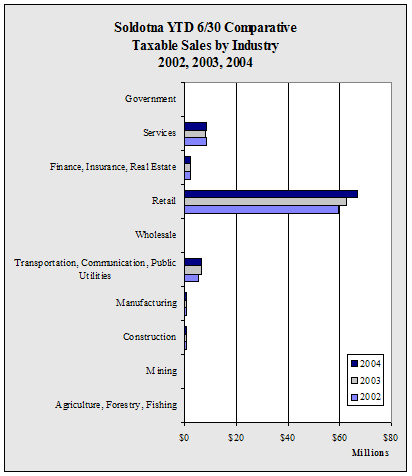
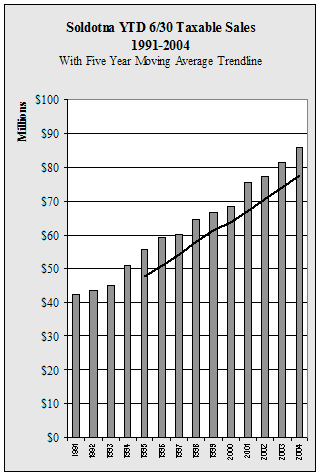
| Soldotna
YTD 6/30 Taxable Sales by Industry - 1998-2004 - in $ |
| |
1998 |
1999 |
2000 |
2001 |
2002 |
2003 |
2004 |
Annual
Change |
| Agriculture,
Forestry, Fishing |
206,432 |
265,144 |
375,326 |
497,909 |
471,817 |
465,019 |
490,048 |
5.4% |
| Mining |
3,985 |
2,450 |
7,855 |
17,854 |
13,861 |
16,775 |
12,503 |
-25.5% |
| Construction |
645,712 |
686,584 |
606,180 |
536,325 |
612,902 |
732,197 |
650,307 |
-11.2% |
| Manufacturing |
624,169 |
571,067 |
607,387 |
665,223 |
610,813 |
656,069 |
566,644 |
-13.6% |
| Transportation,
Communication, Public Utilities |
4,606,669 |
5,047,068 |
5,180,128 |
5,161,771 |
5,371,429 |
6,183,218 |
6,309,472 |
2.0% |
| Wholesale |
123,073 |
140,189 |
300,589 |
407,518 |
366,501 |
461,680 |
408,588 |
-11.5% |
| Retail |
49,434,147 |
51,151,405 |
52,365,902 |
58,569,101 |
59,293,541 |
62,745,676 |
67,028,350 |
6.8% |
| Finance,
Insurance, Real Estate |
1,705,671 |
1,771,466 |
1,927,107 |
2,294,601 |
2,437,300 |
2,293,035 |
2,064,954 |
-9.9% |
| Services |
7,063,682 |
6,990,206 |
7,047,496 |
7,224,674 |
8,043,193 |
7,894,122 |
8,385,163 |
6.2% |
| Government |
12,200 |
19,589 |
13,066 |
11,745 |
14,559 |
20,999 |
15,425 |
-26.5% |
| Total |
64,425,740 |
66,645,168 |
68,431,036 |
75,386,721 |
77,235,916 |
81,468,790 |
85,931,454 |
5.5% |
| Annual
Change |
|
3.4% |
2.7% |
10.2% |
2.5% |
5.5% |
5.5% |
|
|


