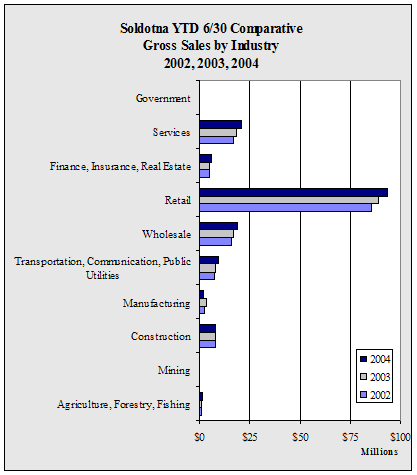
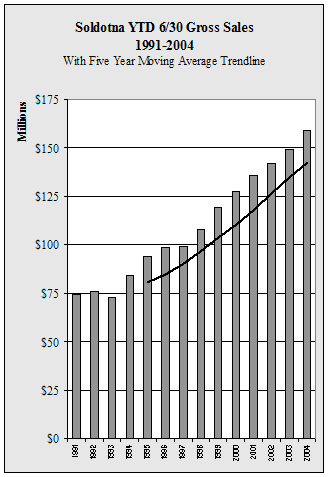
| Soldotna
YTD 6/30 Gross Sales by Industry - 1998-2004 - in $ |
| |
1998 |
1999 |
2000 |
2001 |
2002 |
2003 |
2004 |
Annual
Change |
| Agriculture,
Forestry, Fishing |
290,386 |
326,589 |
537,274 |
701,976 |
724,497 |
845,479 |
1,202,462 |
42.2% |
| Mining |
576,241 |
150,828 |
151,497 |
127,358 |
205,050 |
232,641 |
247,073 |
6.2% |
| Construction |
6,741,324 |
5,478,677 |
7,970,298 |
8,479,817 |
8,158,758 |
7,930,907 |
7,901,135 |
-0.4% |
| Manufacturing |
1,283,083 |
1,246,224 |
1,790,910 |
2,578,965 |
2,628,508 |
3,417,539 |
1,633,714 |
-52.2% |
| Transportation,
Communication, Public Utilities |
6,809,461 |
8,370,737 |
7,723,804 |
9,337,601 |
7,217,176 |
8,038,579 |
9,432,991 |
17.3% |
| Wholesale |
5,168,793 |
12,602,036 |
16,000,696 |
13,808,302 |
15,425,570 |
16,863,880 |
18,687,699 |
10.8% |
| Retail |
69,448,148 |
73,276,500 |
74,075,518 |
80,405,486 |
85,538,279 |
88,938,737 |
93,305,858 |
4.9% |
| Finance,
Insurance, Real Estate |
3,714,742 |
4,136,959 |
4,719,431 |
4,389,995 |
5,241,923 |
5,009,155 |
5,937,325 |
18.5% |
| Services |
14,061,400 |
13,696,783 |
14,734,617 |
15,999,043 |
16,923,356 |
18,034,457 |
20,723,311 |
14.9% |
| Government |
12,200 |
19,589 |
13,066 |
11,745 |
14,559 |
20,999 |
15,425 |
-26.5% |
| Total |
108,105,778 |
119,304,922 |
127,717,111 |
135,840,288 |
142,077,676 |
149,332,373 |
159,086,993 |
6.5% |
| Annual
Change |
|
10.4% |
7.1% |
6.4% |
4.6% |
5.1% |
6.5% |
|
|


