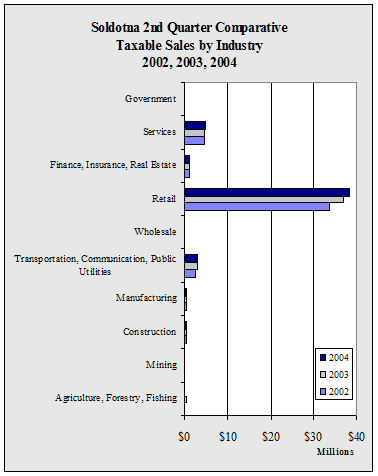
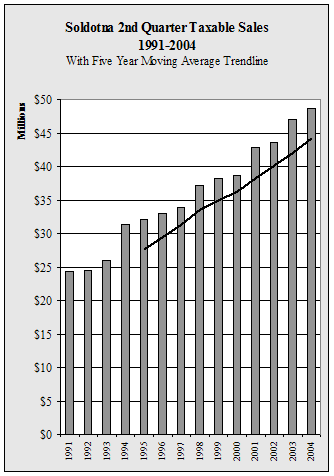
| Soldotna
2nd Quarter Taxable Sales by Industry - 1998-2004 - in $ |
| |
1998 |
1999 |
2000 |
2001 |
2002 |
2003 |
2004 |
Annual
Change |
| Agriculture,
Forestry, Fishing |
118,816 |
170,588 |
227,222 |
314,053 |
286,565 |
297,426 |
270,817 |
-8.9% |
| Mining |
1,023 |
2,450 |
6,707 |
10,242 |
7,414 |
7,401 |
5,828 |
-21.3% |
| Construction |
348,906 |
391,321 |
290,180 |
301,807 |
329,803 |
430,437 |
335,319 |
-22.1% |
| Manufacturing |
380,343 |
371,397 |
412,829 |
465,257 |
429,327 |
436,364 |
368,803 |
-15.5% |
| Transportation,
Communication, Public Utilities |
2,311,939 |
2,502,149 |
2,571,379 |
2,577,578 |
2,619,156 |
2,964,183 |
2,971,242 |
0.2% |
| Wholesale |
71,503 |
80,275 |
229,376 |
282,881 |
231,064 |
288,627 |
254,535 |
-11.8% |
| Retail |
28,967,300 |
29,826,099 |
29,942,234 |
33,538,956 |
33,723,015 |
36,976,302 |
38,493,107 |
4.1% |
| Finance,
Insurance, Real Estate |
918,143 |
913,453 |
1,066,696 |
1,222,567 |
1,266,667 |
1,151,616 |
1,103,862 |
-4.1% |
| Services |
4,116,968 |
3,940,745 |
4,014,214 |
4,184,003 |
4,600,505 |
4,451,014 |
4,753,770 |
6.8% |
| Government |
5,958 |
6,763 |
5,779 |
5,238 |
7,859 |
8,680 |
8,521 |
-1.8% |
| Total |
37,240,899 |
38,205,240 |
38,766,616 |
42,902,582 |
43,501,375 |
47,012,050 |
48,565,804 |
3.3% |
| Annual
Change |
|
2.6% |
1.5% |
10.7% |
1.4% |
8.1% |
3.3% |
|
|


