| Soldotna
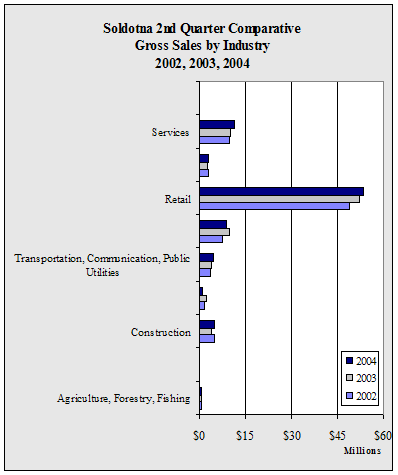
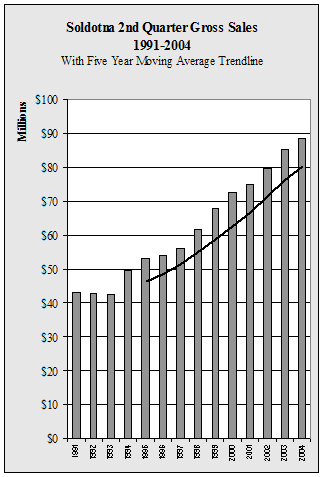
2nd Quarter Gross Sales by Industry - 1998-2004 - in $ |
| |
1998 |
1999 |
2000 |
2001 |
2002 |
2003 |
2004 |
Annual
Change |
| Agriculture,
Forestry, Fishing |
197,181 |
228,635 |
379,092 |
486,756 |
493,143 |
558,058 |
645,477 |
15.7% |
| Mining |
122,232 |
103,776 |
80,235 |
77,886 |
106,949 |
122,012 |
154,892 |
26.9% |
| Construction |
4,100,412 |
3,171,056 |
4,925,887 |
4,464,446 |
4,930,716 |
3,932,989 |
5,026,264 |
27.8% |
| Manufacturing |
831,276 |
764,920 |
1,149,365 |
1,611,027 |
1,727,614 |
2,288,148 |
1,089,931 |
-52.4% |
| Transportation,
Communication, Public Utilities |
3,476,993 |
4,379,100 |
3,684,195 |
4,573,146 |
3,531,451 |
3,827,252 |
4,636,018 |
21.1% |
| Wholesale |
2,977,300 |
6,802,549 |
8,721,917 |
6,981,240 |
7,353,520 |
9,554,591 |
8,967,548 |
-6.1% |
| Retail |
40,327,861 |
42,762,715 |
42,547,382 |
45,690,237 |
49,051,032 |
52,168,027 |
53,724,783 |
3.0% |
| Finance,
Insurance, Real Estate |
1,917,046 |
2,036,799 |
2,743,036 |
2,223,114 |
2,983,720 |
2,547,857 |
2,904,404 |
14.0% |
| Services |
7,904,189 |
7,618,629 |
8,278,327 |
8,927,244 |
9,561,114 |
10,123,115 |
11,241,499 |
11.0% |
| Government |
5,958 |
6,763 |
5,779 |
5,238 |
7,859 |
8,680 |
8,521 |
-1.8% |
| Total |
61,860,448 |
67,874,942 |
72,515,215 |
75,040,334 |
79,747,118 |
85,130,729 |
88,399,337 |
3.8% |
| Annual
Change |
|
9.7% |
6.8% |
3.5% |
6.3% |
6.8% |
3.8% |
|
|


