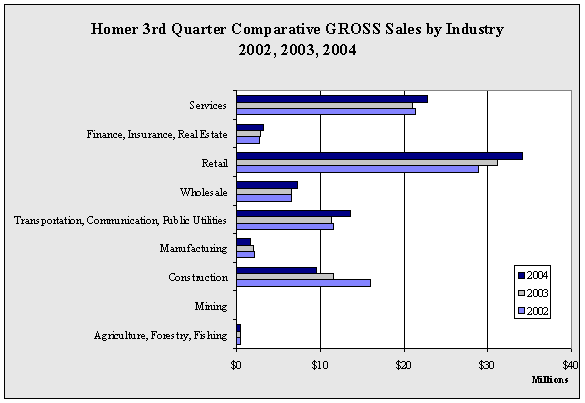
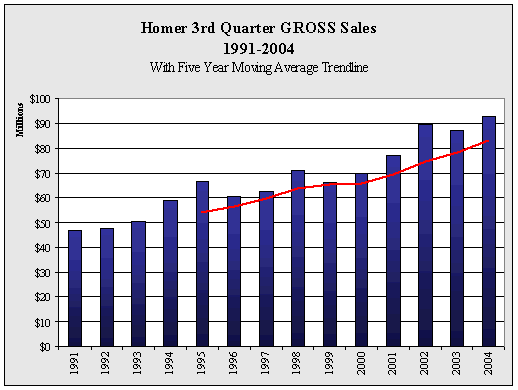
| Homer
3rd Quarter GROSS Sales by Industry - 1998-2004 - in $ |
| |
1998 |
1999 |
2000 |
2001 |
2002 |
2003 |
2004 |
Annual
Change |
| AFF |
492,748 |
271,045 |
617,216 |
369,625 |
358,911 |
485,712 |
512,372 |
5.5% |
| Min |
0 |
13,400 |
23,747 |
4,209 |
3,383 |
448 |
695 |
55.1% |
| Const |
16,130,230 |
7,328,638 |
13,266,938 |
13,713,481 |
15,972,357 |
11,530,115 |
9,546,929 |
-17.2% |
| Manu |
4,629,816 |
6,232,592 |
1,509,013 |
1,967,400 |
2,153,455 |
2,019,280 |
1,647,079 |
-18.4% |
| TCPU |
9,469,610 |
9,083,098 |
9,917,768 |
12,698,696 |
11,525,181 |
11,335,988 |
13,571,984 |
19.7% |
| Whole |
4,543,606 |
5,492,391 |
5,604,085 |
6,252,096 |
6,595,619 |
6,629,440 |
7,325,763 |
10.5% |
| Retail |
20,515,617 |
21,600,116 |
22,996,502 |
24,146,435 |
28,947,145 |
31,177,398 |
34,099,243 |
9.4% |
| FIRE |
2,524,759 |
1,926,974 |
1,955,965 |
2,273,892 |
2,696,231 |
2,819,421 |
3,277,696 |
16.3% |
| Service |
12,579,765 |
14,404,867 |
14,070,134 |
15,579,884 |
21,408,681 |
21,039,052 |
22,814,668 |
8.4% |
| Total |
70,886,151 |
66,353,121 |
69,961,368 |
77,005,718 |
89,660,963 |
87,036,854 |
92,796,429 |
6.6% |
| Annual
Change |
|
-6.4% |
5.4% |
10.1% |
16.4% |
-2.9% |
6.6% |
|
|


