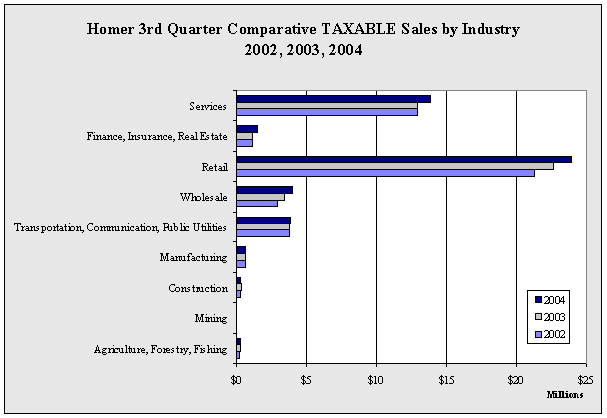
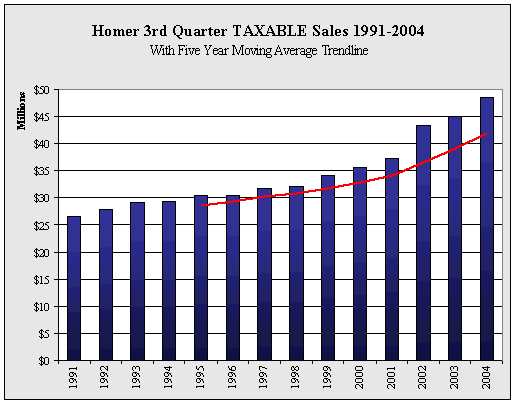
| Homer
3rd Quarter TAXABLE Sales by Industry - 1998-2004 - in $ |
| |
1998 |
1999 |
2000 |
2001 |
2002 |
2003 |
2004 |
Annual
Change |
| Agriculture,
Forestry, Fishing |
192,701 |
146,340 |
149,462 |
177,823 |
195,905 |
250,473 |
305,982 |
22.2% |
| Mining |
0 |
0 |
500 |
2,175 |
0 |
0 |
0 |
NA
|
| Construction |
264,104 |
223,001 |
239,938 |
280,862 |
324,412 |
333,795 |
296,479 |
-11.2% |
| Manufacturing |
629,601 |
619,889 |
588,489 |
525,720 |
597,126 |
618,081 |
607,120 |
-1.8% |
Transportation,
Communication,
Public Utilities |
2,827,790 |
2,999,198 |
3,098,352 |
3,245,406 |
3,752,729 |
3,752,532 |
3,884,754 |
3.5% |
| Wholesale |
2,287,530 |
2,550,653 |
2,803,690 |
2,883,405 |
2,928,198 |
3,370,701 |
3,998,096 |
18.6% |
| Retail |
15,769,364 |
16,429,320 |
17,384,695 |
18,272,392 |
21,300,348 |
22,632,041 |
23,953,878 |
5.8% |
| Finance,
Insurance, Real Estate |
793,724 |
848,368 |
918,668 |
1,004,143 |
1,165,651 |
1,140,719 |
1,427,618 |
25.2% |
| Services |
9,338,934 |
10,430,960 |
10,448,267 |
10,864,894 |
12,976,685 |
12,965,331 |
13,891,639 |
7.1% |
| Total |
32,103,748 |
34,247,729 |
35,632,061 |
37,256,820 |
43,241,054 |
45,063,673 |
48,365,566 |
7.3% |
| Annual
Change |
|
6.7% |
4.0% |
4.6% |
16.1% |
4.2% |
7.3% |
|
|


