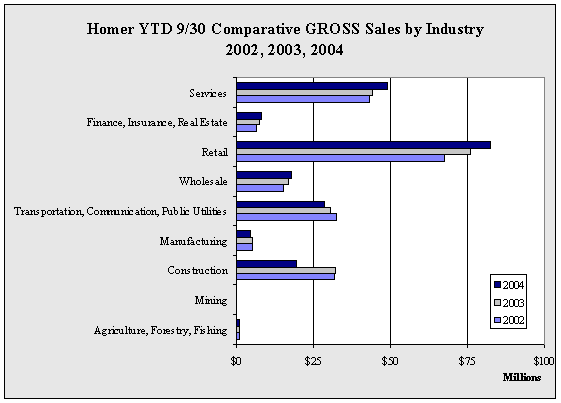
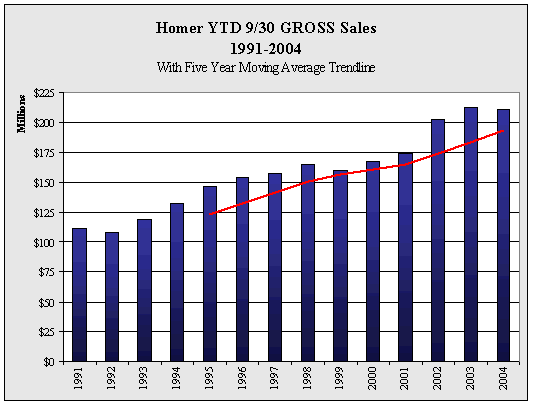
| Homer
YTD 9/30 GROSS Sales by Industry - 1998-2004 - in $ |
| |
1998 |
1999 |
2000 |
2001 |
2002 |
2003 |
2004 |
Annual
Change |
| Agriculture,
Forestry, Fishing |
946,246 |
662,392 |
1,407,492 |
751,448 |
744,012 |
1,155,191 |
1,171,819 |
1.4% |
| Mining |
0 |
13,595 |
23,747 |
15,190 |
8,582 |
448 |
1,055 |
135.5% |
| Construction |
29,666,658 |
19,217,701 |
32,370,872 |
28,564,046 |
31,841,012 |
32,022,451 |
19,552,493 |
-38.9% |
| Manufacturing |
14,725,520 |
14,480,398 |
5,201,883 |
4,747,986 |
5,197,710 |
5,236,851 |
4,570,869 |
-12.7% |
| Transportation,
Communication, Public Utilities |
26,168,657 |
25,636,218 |
26,264,813 |
30,018,520 |
32,291,566 |
30,575,179 |
28,577,110 |
-6.5% |
| Wholesale |
11,361,597 |
14,235,936 |
13,233,736 |
14,956,778 |
15,313,761 |
16,766,848 |
17,869,672 |
6.6% |
| Retail |
50,011,580 |
51,215,265 |
55,085,151 |
58,044,303 |
67,698,168 |
75,805,630 |
82,283,953 |
8.5% |
| Finance,
Insurance, Real Estate |
6,657,677 |
5,801,863 |
5,085,630 |
5,653,330 |
6,270,545 |
7,356,933 |
8,141,944 |
10.7% |
| Services |
26,105,065 |
28,514,589 |
28,976,343 |
31,820,581 |
43,212,014 |
44,183,000 |
48,920,423 |
10.7% |
| Government |
0 |
0 |
0 |
0 |
0 |
0 |
394 |
NA |
| Total |
165,643,000 |
159,777,957 |
167,649,667 |
174,572,182 |
202,577,370 |
213,102,531 |
211,089,732 |
-0.9% |
| Annual
Change |
|
-3.5% |
4.9% |
4.1% |
16.0% |
5.2% |
-0.9% |
|
|


