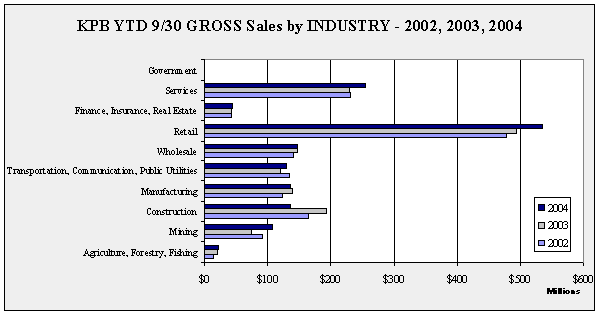
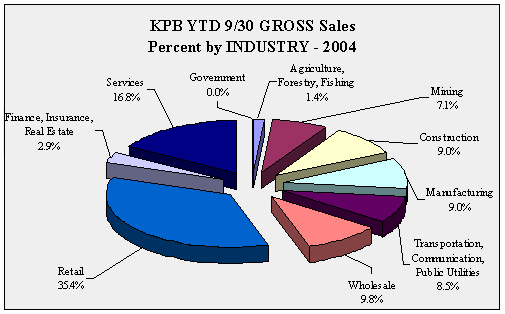
| KPB
YTD 9/30 GROSS Sales by INDUSTRY - 1998-2004 - in $ |
| |
1998 |
1999 |
2000 |
2001 |
2002 |
2003 |
2004 |
Annual
Change |
Agriculture,
Forestry,
Fishing |
26,505,916 |
29,932,359 |
23,411,329 |
15,619,297 |
14,697,049 |
19,556,802 |
21,834,091 |
11.6% |
| Mining |
141,590,983 |
82,835,844 |
83,451,127 |
90,068,349 |
90,840,113 |
74,710,807 |
107,597,146 |
44.0% |
| Construction |
131,736,746 |
116,222,435 |
131,599,154 |
177,837,815 |
164,632,268 |
192,368,990 |
136,523,309 |
-29.0% |
| Manufacturing |
112,529,404 |
124,440,056 |
93,340,549 |
170,252,210 |
122,774,068 |
139,052,552 |
136,407,888 |
-1.9% |
| Transportation,
Communication, Public Utilities |
120,645,092 |
125,754,388 |
117,281,540 |
129,987,997 |
134,774,200 |
121,098,515 |
129,303,718 |
6.8% |
| Wholesale |
113,804,432 |
117,814,212 |
133,701,371 |
136,283,498 |
140,813,502 |
147,629,417 |
147,668,730 |
0.0% |
| Retail |
416,625,005 |
415,531,893 |
437,244,359 |
477,366,088 |
478,509,946 |
494,226,561 |
535,908,597 |
8.4% |
Finance,
Insurance,
Real Estate |
38,456,308 |
40,343,965 |
37,863,757 |
40,743,006 |
42,376,664 |
43,045,697 |
44,229,730 |
2.8% |
| Services |
172,652,399 |
181,472,372 |
193,072,803 |
208,411,109 |
231,232,137 |
228,547,975 |
254,357,804 |
11.3% |
| Government |
23,947 |
25,165 |
15,103 |
19,116 |
18,849 |
33,191 |
31,368 |
-5.5% |
| Total |
1,274,570,232 |
1,234,372,689 |
1,250,981,092 |
1,446,588,485 |
1,420,668,796 |
1,460,270,507 |
1,513,862,381 |
3.7% |
| Annual
Change |
|
-3.2% |
1.3% |
15.6% |
-1.8% |
2.8% |
3.7% |
|
|
KPB
YTD 9/30 GROSS Sales Ten Year Change
by INDUSTRY - 1994-2004 - in $ |
| |
|
|
10
Year Change |
| |
1994 |
2004 |
Percentage |
Numerical |
Agriculture,
Forestry,
Fishing |
48,517,244 |
21,834,091 |
-55.0% |
-26,683,153 |
| Mining |
93,617,574 |
107,597,146 |
14.9% |
13,979,572 |
| Construction |
102,385,359 |
136,523,309 |
33.3% |
34,137,950 |
| Manufacturing |
98,711,018 |
136,407,888 |
38.2% |
37,696,870 |
Transportation,
Communication,
Public Utilities |
164,384,016 |
129,303,718 |
-21.3% |
-35,080,298 |
| Wholesale |
61,602,360 |
147,668,730 |
139.7% |
86,066,370 |
| Retail |
309,388,359 |
535,908,597 |
73.2% |
226,520,238 |
Finance,
Insurance,
Real Estate |
42,617,594 |
44,229,730 |
3.8% |
1,612,136 |
| Services |
136,637,042 |
254,357,804 |
86.2% |
117,720,762 |
| Government |
7,512 |
31,368 |
317.6% |
23,856 |
| Total |
1,057,868,078 |
1,513,862,381 |
43.1% |
455,994,303 |
|
KPB
YTD 9/30 GROSS Sales One Year Change
by INDUSTRY - 2003-2004 - in $ |
| |
|
|
1
Year Change |
| |
2003 |
2004 |
Percentage |
Numerical |
Agriculture,
Forestry,
Fishing |
19,556,802 |
21,834,091 |
11.6% |
2,277,289 |
| Mining |
74,710,807 |
107,597,146 |
44.0% |
32,886,339 |
| Construction |
192,368,990 |
136,523,309 |
-29.0% |
-55,845,681 |
| Manufacturing |
139,052,552 |
136,407,888 |
-1.9% |
-2,644,664 |
| Transportation,
Communication, Public Utilities |
121,098,515 |
129,303,718 |
6.8% |
8,205,203 |
| Wholesale |
147,629,417 |
147,668,730 |
0.0% |
39,313 |
| Retail |
494,226,561 |
535,908,597 |
8.4% |
41,682,036 |
Finance,
Insurance,
Real Estate |
43,045,697 |
44,229,730 |
2.8% |
1,184,033 |
| Services |
228,547,975 |
254,357,804 |
11.3% |
25,809,829 |
| Government |
33,191 |
31,368 |
-5.5% |
-1,823 |
| Total |
1,460,270,507 |
1,513,862,381 |
3.7% |
53,591,874 |
|


