| KPB
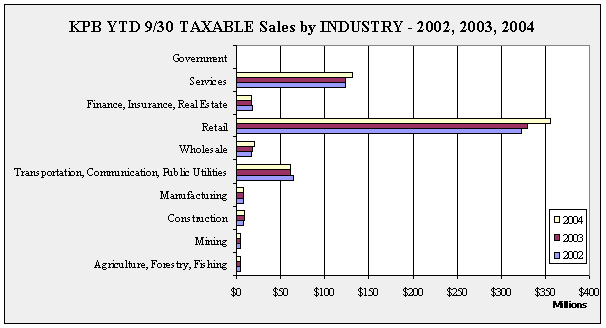
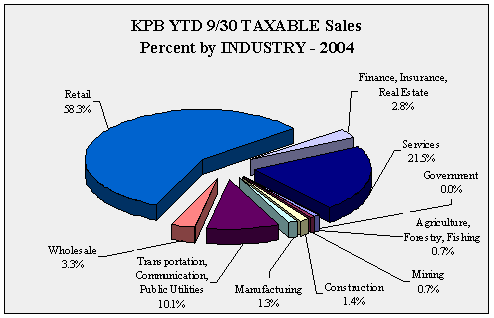
YTD 9/30 TAXABLE Sales by INDUSTRY - 1998-2004 - in $ |
| |
1998 |
1999 |
2000 |
2001 |
2002 |
2003 |
2004 |
Annual
Change |
| Agriculture,
Forestry, Fishing |
2,703,362 |
2,819,203 |
3,290,269 |
3,568,750 |
3,620,376 |
4,038,077 |
4,475,536 |
10.8% |
| Mining |
4,159,321 |
2,730,828 |
3,353,218 |
4,253,804 |
4,517,435 |
3,717,982 |
4,001,874 |
7.6% |
| Construction |
7,214,943 |
7,357,411 |
7,258,460 |
7,439,498 |
7,999,850 |
8,490,169 |
8,310,926 |
-2.1% |
| Manufacturing |
7,737,893 |
7,336,740 |
7,806,312 |
7,886,389 |
7,816,529 |
7,379,306 |
7,996,360 |
8.4% |
| Transportation,
Communication, Public Utilities |
54,202,371 |
57,677,741 |
58,621,979 |
58,974,816 |
64,326,019 |
61,862,871 |
61,611,718 |
-0.4% |
| Wholesale |
13,930,745 |
14,143,083 |
16,357,422 |
16,749,727 |
16,779,106 |
18,385,545 |
19,999,573 |
8.8% |
| Retail |
268,152,307 |
279,095,724 |
290,933,710 |
312,542,226 |
321,858,985 |
330,327,883 |
356,299,259 |
7.9% |
Finance,
Insurance,
Real Estate |
14,112,221 |
14,585,260 |
15,394,784 |
17,606,978 |
18,445,573 |
17,734,658 |
17,005,186 |
-4.1% |
| Services |
102,743,707 |
109,801,892 |
114,938,189 |
118,225,988 |
123,726,224 |
124,073,510 |
131,665,545 |
6.1% |
| Government |
23,947 |
25,165 |
15,103 |
19,116 |
18,849 |
33,191 |
31,303 |
-5.7% |
| Total |
474,980,817 |
495,573,047 |
517,969,446 |
547,267,292 |
569,108,946 |
576,043,192 |
611,397,280 |
6.1% |
| Annual
Change |
|
4.3% |
4.5% |
5.7% |
4.0% |
1.2% |
6.1% |
|
|
KPB
YTD 9/30 TAXABLE Sales Ten Year Change by INDUSTRY
1994 v. 2004 - in $ |
| |
|
|
10
Year Change |
| |
1994 |
2004 |
Percentage |
Numerical |
Agriculture,
Forestry,
Fishing |
2,893,232 |
4,475,536 |
54.7% |
1,582,304 |
| Mining |
4,845,162 |
4,001,874 |
-17.4% |
-843,288 |
| Construction |
5,864,340 |
8,310,926 |
41.7% |
2,446,586 |
| Manufacturing |
6,231,290 |
7,996,360 |
28.3% |
1,765,070 |
| Transportation,
Communication, Public Utilities |
48,058,940 |
61,611,718 |
28.2% |
13,552,778 |
| Wholesale |
14,903,328 |
19,999,573 |
34.2% |
5,096,245 |
| Retail |
227,714,271 |
356,299,259 |
56.5% |
128,584,988 |
Finance,
Insurance,
Real Estate |
13,919,523 |
17,005,186 |
22.2% |
3,085,663 |
| Services |
83,507,007 |
131,665,545 |
57.7% |
48,158,538 |
| Government |
7,512 |
31,303 |
316.7% |
23,791 |
| Total |
407,944,605 |
611,397,280 |
49.9% |
203,452,675 |
|
KPB
YTD 9/30 TAXABLE Sales One Year
Change by INDUSTRY - 2003 v. 2004 - in $ |
| |
|
|
1
Year Change |
| |
2003 |
2004 |
Percentage |
Numerical |
| Agriculture,
Forestry, Fishing |
4,038,077 |
4,475,536 |
10.8% |
437,459 |
| Mining |
3,717,982 |
4,001,874 |
7.6% |
283,892 |
| Construction |
8,490,169 |
8,310,926 |
-2.1% |
-179,243 |
| Manufacturing |
7,379,306 |
7,996,360 |
8.4% |
617,054 |
| Transportation,
Communication, Public Utilities |
61,862,871 |
61,611,718 |
-0.4% |
-251,153 |
| Wholesale |
18,385,545 |
19,999,573 |
8.8% |
1,614,028 |
| Retail |
330,327,883 |
356,299,259 |
7.9% |
25,971,376 |
Finance,
Insurance,
Real Estate |
17,734,658 |
17,005,186 |
-4.1% |
-729,472 |
| Services |
124,073,510 |
131,665,545 |
6.1% |
7,592,035 |
| Government |
33,191 |
31,303 |
-5.7% |
-1,888 |
| Total |
576,043,192 |
611,397,280 |
6.1% |
35,354,088 |
|


