|
|
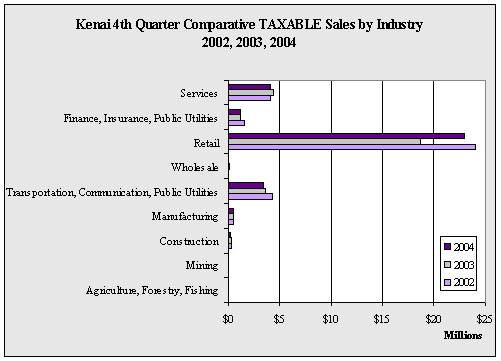
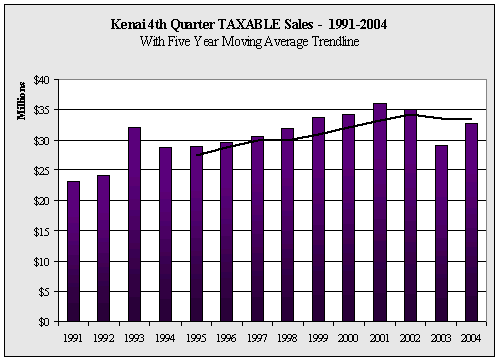
Kenai 4th Quarter TAXABLE Sales by Industry - 1998-2004 - in $
|
| |
1998 |
1999 |
2000 |
2001 |
2002 |
2003 |
2004 |
Annual
Change |
| Agriculture,
Forestry, Fishing |
93,304 |
91,253 |
89,000 |
100,269 |
86,211 |
99,292 |
109,314 |
10.1% |
| Mining |
8,764 |
40,690 |
46,005 |
41,886 |
52,224 |
60,465 |
66,021 |
9.2% |
| Construction |
328,236 |
323,173 |
287,662 |
354,826 |
296,515 |
317,640 |
264,939 |
-16.6% |
| Manufacturing |
394,728 |
442,960 |
552,715 |
414,560 |
491,314 |
506,419 |
514,348 |
1.6% |
| Transportation,
Communication, Public Utilities |
3,327,590 |
5,377,374 |
3,237,855 |
3,457,229 |
4,309,543 |
3,632,232 |
3,478,103 |
-4.2% |
| Wholesale |
217,893 |
217,551 |
203,256 |
153,504 |
123,316 |
180,546 |
103,885 |
-42.5% |
| Retail |
22,614,704 |
22,296,352 |
23,950,857 |
25,525,358 |
23,983,760 |
18,669,361 |
22,931,159 |
22.8% |
| Finance,
Insurance, Public Utilities |
1,213,222 |
1,146,639 |
1,615,987 |
1,768,098 |
1,564,165 |
1,252,833 |
1,197,436 |
-4.4% |
| Services |
3,758,639 |
3,781,751 |
4,078,976 |
4,187,469 |
4,081,675 |
4,369,744 |
4,116,935 |
-5.8% |
| Government |
86 |
72 |
32 |
0 |
0 |
0 |
0 |
NA |
| Total |
31,957,166 |
33,717,815 |
34,062,345 |
36,003,199 |
34,988,723 |
29,088,532 |
32,782,140 |
12.7% |
| Annual
Change |
|
5.5% |
1.0% |
5.7% |
-2.8% |
-16.9% |
12.7% |
|
|


