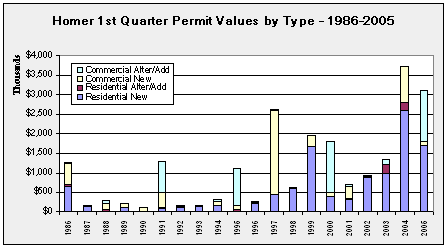
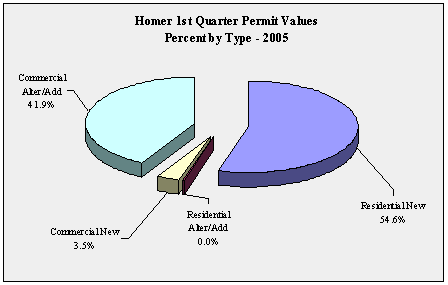
| Homer
1st Quarter Permit Values by Type - 1999-2005 - in $ |
| |
1999 |
2000 |
2001 |
2002 |
2003 |
2004 |
2005 |
Annual
Change |
| Residential
New |
1,673,000 |
392,600 |
300,000 |
891,760 |
979,800 |
2,597,500 |
1,694,400 |
-34.8% |
| Residential
Alter/Add |
0 |
5,500 |
60,000 |
8,960 |
232,540 |
201,520 |
1,500 |
-99.3% |
| Commercial
New |
270,000 |
85,000 |
285,000 |
0 |
0 |
915,000 |
108,000 |
-88.2% |
| Commercial
Alter/Add |
0 |
1,315,000 |
45,000 |
28,000 |
122,000 |
0 |
1,302,000 |
NA
|
| TOTAL |
1,943,000 |
1,798,100 |
690,000 |
928,720 |
1,334,340 |
3,714,020 |
3,105,900 |
-16.4% |
| Annual
Change |
|
-7.5% |
-61.6% |
34.6% |
43.7% |
178.3% |
-16.4% |
|
|


