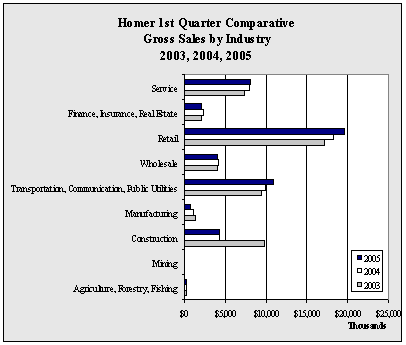
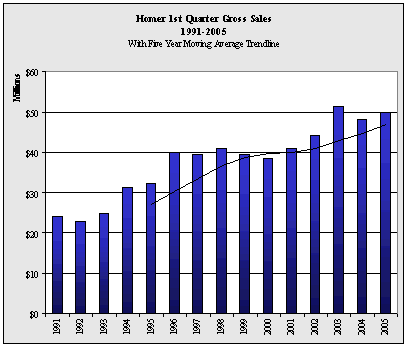
| Homer
1st Quarter Gross Sales by Industry - 1999-2005 - in $ |
| |
1999 |
2000 |
2001 |
2002 |
2003 |
2004 |
2005 |
Annual
Change |
| Agriculture,
Forestry, Fishing |
94,065 |
174,500 |
160,466 |
134,712 |
249,333 |
229,352 |
264,446 |
15.3% |
| Mining |
195 |
0 |
9,137 |
1,363 |
0 |
256 |
0 |
NA
|
| Construction |
6,011,769 |
7,295,167 |
8,123,440 |
8,430,924 |
9,795,523 |
4,325,965 |
4,253,028 |
-1.7% |
| Manufacturing |
3,510,592 |
1,753,833 |
1,325,393 |
1,253,834 |
1,317,636 |
1,116,143 |
725,931 |
-35.0% |
| Transportation,
Communication, Public Utilities |
8,313,407 |
7,762,978 |
8,393,207 |
9,784,288 |
9,460,657 |
9,977,448 |
10,868,207 |
8.9% |
| Wholesale |
4,137,168 |
3,177,603 |
3,500,654 |
3,358,010 |
4,044,595 |
4,122,172 |
3,928,233 |
-4.7% |
| Retail |
11,284,262 |
12,205,397 |
12,926,124 |
13,767,872 |
17,108,705 |
18,227,417 |
19,595,441 |
7.5% |
| Finance,
Insurance, Real Estate |
1,957,019 |
1,447,561 |
1,405,203 |
1,527,725 |
1,989,925 |
2,247,358 |
1,996,686 |
-11.2% |
| Service |
4,245,171 |
4,638,128 |
5,001,354 |
6,006,218 |
7,261,902 |
7,895,860 |
8,120,660 |
2.8% |
| Government |
0 |
0 |
0 |
0 |
0 |
394 |
0 |
-100.0% |
| Total |
39,553,648 |
38,455,167 |
40,844,978 |
44,264,946 |
51,228,276 |
48,142,365 |
49,752,632 |
3.3% |
| Annual
Change |
|
-2.8% |
6.2% |
8.4% |
15.7% |
-6.0% |
3.3% |
|
|


