| Homer
1st Quarter Taxable Sales by Industry - 1999-2005 - in $ |
| |
1999 |
2000 |
2001 |
2002 |
2003 |
2004 |
2005 |
Annual
Change |
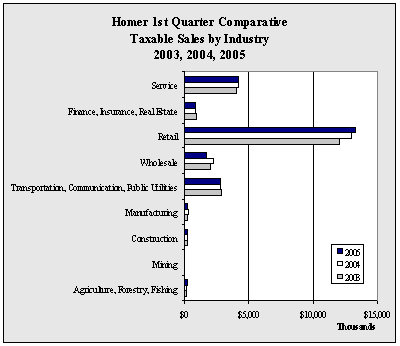
| Agriculture,
Forestry, Fishing |
79,865 |
108,581 |
108,289 |
117,273 |
135,734 |
157,957 |
181,451 |
14.9% |
| Mining |
195 |
0 |
1,640 |
710 |
0 |
0 |
0 |
NA
|
| Construction |
182,033 |
214,922 |
178,792 |
237,634 |
243,346 |
276,885 |
219,709 |
-20.6% |
| Manufacturing |
345,033 |
352,233 |
325,875 |
263,252 |
277,526 |
305,351 |
212,592 |
-30.4% |
| Transportation,
Communication, Public Utilities |
2,300,797 |
2,182,015 |
2,129,650 |
2,225,122 |
2,890,615 |
2,806,506 |
2,836,081 |
1.1% |
| Wholesale |
1,510,910 |
1,649,698 |
1,691,835 |
1,662,455 |
2,010,808 |
2,234,379 |
1,690,457 |
-24.3% |
| Retail |
8,815,674 |
9,187,838 |
9,549,519 |
10,100,688 |
11,998,705 |
12,978,758 |
13,291,621 |
2.4% |
| Finance,
Insurance, Real Estate |
661,240 |
675,571 |
692,034 |
768,568 |
900,146 |
890,703 |
826,738 |
-7.2% |
| Service |
2,742,720 |
2,957,002 |
3,087,570 |
3,321,402 |
3,993,060 |
4,175,189 |
4,185,920 |
0.3% |
| Government |
0 |
0 |
0 |
0 |
0 |
394 |
0 |
-100.0% |
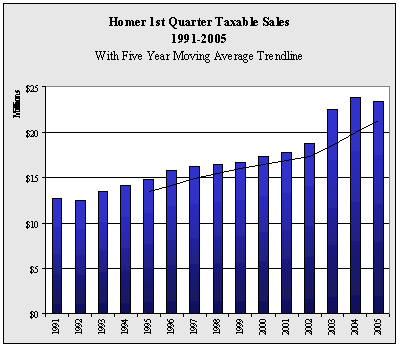
| Total |
16,638,467 |
17,327,860 |
17,765,204 |
18,697,104 |
22,449,940 |
23,826,122 |
23,444,569 |
-1.6% |
| Annual
Change |
|
4.1% |
2.5% |
5.2% |
20.1% |
6.1% |
-1.6% |
|
|