| KPB
Employment by Month - 1990-2005 |
| |
Jan |
Feb |
Mar |
Apr |
May |
Jun |
Jul |
Aug |
Sep |
Oct |
Nov |
Dec |
Avg |
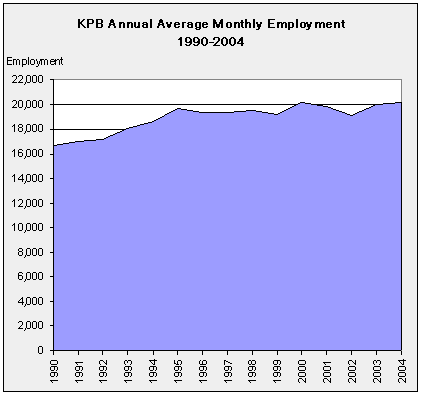
| 1990 |
14,800 |
15,163 |
15,456 |
16,241 |
17,046 |
18,312 |
19,846 |
19,262 |
16,707 |
16,208 |
15,756 |
15,496 |
16,691 |
| 1991 |
15,420 |
15,652 |
15,969 |
16,834 |
17,423 |
18,471 |
20,346 |
19,563 |
17,778 |
16,145 |
15,521 |
15,051 |
17,014 |
| 1992 |
14,576 |
15,080 |
15,590 |
16,299 |
17,137 |
19,156 |
20,256 |
19,405 |
18,381 |
17,329 |
16,426 |
16,082 |
17,143 |
| 1993 |
14,882 |
15,693 |
16,486 |
17,091 |
17,863 |
20,352 |
22,136 |
21,336 |
18,902 |
18,043 |
17,151 |
16,607 |
18,045 |
| 1994 |
16,205 |
17,470 |
17,911 |
17,624 |
18,429 |
20,747 |
22,221 |
21,452 |
19,259 |
18,234 |
17,511 |
16,639 |
18,642 |
| 1995 |
17,014 |
17,556 |
17,828 |
17,855 |
18,862 |
20,502 |
22,203 |
21,635 |
19,695 |
28,715 |
17,634 |
16,949 |
19,704 |
| 1996 |
17,153 |
17,808 |
18,330 |
18,446 |
19,712 |
21,232 |
23,028 |
22,696 |
20,577 |
18,613 |
17,757 |
17,037 |
19,366 |
| 1997 |
17,286 |
17,934 |
18,049 |
18,624 |
19,298 |
21,394 |
23,090 |
22,430 |
20,374 |
18,619 |
17,814 |
17,286 |
19,350 |
| 1998 |
17,668 |
17,740 |
17,895 |
18,254 |
19,491 |
21,400 |
23,116 |
22,948 |
20,937 |
19,146 |
18,118 |
17,428 |
19,512 |
| 1999 |
17,508 |
17,726 |
18,035 |
18,529 |
19,237 |
20,820 |
22,120 |
21,639 |
20,359 |
18,898 |
17,950 |
17,530 |
19,196 |
| 2000 |
18,257 |
18,516 |
18,596 |
18,939 |
20,172 |
22,097 |
22,237 |
22,060 |
21,131 |
20,015 |
19,799 |
19,750 |
20,131 |
| 2001 |
18,481 |
18,406 |
18,545 |
18,821 |
20,022 |
21,686 |
22,589 |
21,496 |
20,484 |
19,597 |
19,342 |
19,274 |
19,895 |
| 2002 |
17,618 |
17,912 |
18,176 |
18,737 |
19,513 |
20,701 |
21,913 |
21,453 |
19,702 |
17,819 |
18,647 |
17,445 |
19,136 |
| 2003 |
19,042 |
18,783 |
19,135 |
19,461 |
20,577 |
21,626 |
22,317 |
21,629 |
20,041 |
19,370 |
19,141 |
18,924 |
20,004 |
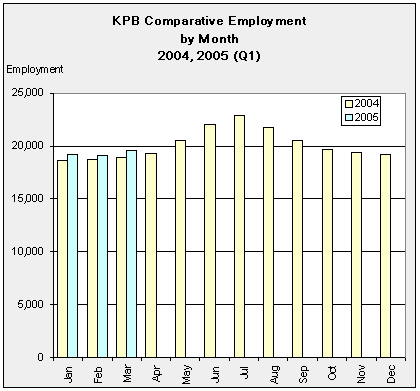
| 2004 |
18,610 |
18,715 |
18,901 |
19,287 |
20,553 |
22,049 |
22,817 |
21,790 |
20,533 |
19,692 |
19,447 |
19,250 |
20,137 |
| 2005 |
19,166 |
19,078 |
19,531 |
|
|
|
|
|
|
|
|
|
|
|


