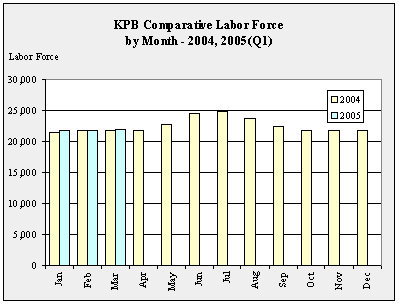
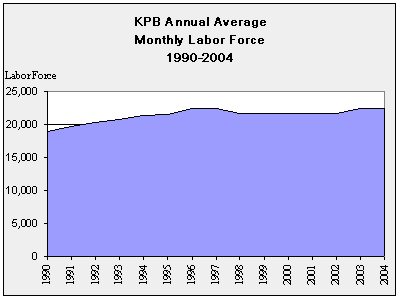
| KPB
Labor Force by Month - 1990-2005 |
| |
Jan |
Feb |
Mar |
Apr |
May |
Jun |
Jul |
Aug |
Sep |
Oct |
Nov |
Dec |
Avg |
| 1990 |
17,484 |
17,834 |
17,907 |
18,562 |
19,163 |
20,281 |
21,497 |
20,995 |
18,632 |
18,592 |
18,087 |
17,804 |
18,903 |
| 1991 |
18,314 |
18,612 |
18,738 |
19,469 |
19,806 |
20,852 |
22,525 |
21,608 |
19,981 |
19,045 |
18,919 |
18,574 |
19,704 |
| 1992 |
18,749 |
19,468 |
19,366 |
19,734 |
20,218 |
22,206 |
22,766 |
21,409 |
20,614 |
20,300 |
19,409 |
19,138 |
20,281 |
| 1993 |
18,526 |
19,509 |
19,827 |
20,175 |
20,457 |
22,835 |
24,085 |
23,031 |
20,626 |
20,550 |
19,792 |
19,293 |
20,726 |
| 1994 |
19,602 |
21,104 |
21,193 |
20,557 |
21,046 |
23,263 |
24,611 |
23,372 |
21,078 |
20,922 |
20,057 |
19,392 |
21,350 |
| 1995 |
20,603 |
21,179 |
20,971 |
20,505 |
21,100 |
22,740 |
24,340 |
23,498 |
21,559 |
21,432 |
20,441 |
19,915 |
21,524 |
| 1996 |
20,902 |
21,795 |
21,739 |
21,609 |
22,651 |
24,000 |
25,583 |
24,841 |
23,228 |
21,906 |
21,335 |
20,561 |
22,513 |
| 1997 |
21,742 |
22,421 |
21,898 |
21,993 |
22,076 |
24,208 |
25,480 |
24,414 |
22,467 |
21,325 |
20,589 |
19,953 |
22,381 |
| 1998 |
20,677 |
20,713 |
20,426 |
20,395 |
21,346 |
23,475 |
24,773 |
24,319 |
22,567 |
21,208 |
20,112 |
19,520 |
21,628 |
| 1999 |
20,429 |
21,171 |
20,932 |
21,048 |
21,466 |
23,076 |
24,114 |
23,381 |
22,244 |
21,096 |
20,202 |
19,727 |
21,574 |
| 2000 |
20,787 |
21,091 |
21,041 |
21,077 |
22,115 |
23,940 |
23,783 |
23,616 |
22,627 |
21,686 |
21,670 |
21,769 |
21,736 |
| 2001 |
20,807 |
20,784 |
20,821 |
20,865 |
21,789 |
23,496 |
24,134 |
23,057 |
22,045 |
21,353 |
21,307 |
21,454 |
21,676 |
| 2002 |
20,596 |
20,969 |
21,108 |
21,305 |
21,893 |
22,863 |
24,201 |
23,601 |
22,099 |
20,554 |
21,261 |
20,446 |
21,741 |
| 2003 |
21,974 |
21,827 |
21,925 |
22,025 |
22,923 |
24,172 |
24,489 |
23,759 |
22,176 |
21,684 |
21,660 |
21,565 |
22,515 |
| 2004 |
21,566 |
21,684 |
21,798 |
21,795 |
22,825 |
24,468 |
24,850 |
23,746 |
22,504 |
21,821 |
21,756 |
21,679 |
22,541 |
| 2005 |
21,856 |
21,841 |
21,980 |
|
|
|
|
|
|
|
|
|
|
|


