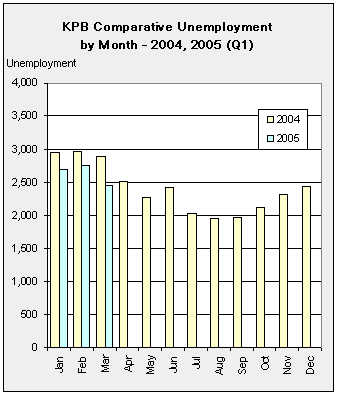
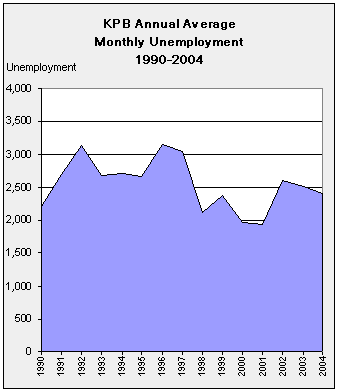
| KPB
Unemployment by Month - 1990-2005 |
| |
Jan |
Feb |
Mar |
Apr |
May |
Jun |
Jul |
Aug |
Sep |
Oct |
Nov |
Dec |
Avg |
| 1990 |
2,684 |
2,671 |
2,451 |
2,321 |
2,117 |
1,969 |
1,651 |
1,733 |
1,925 |
2,384 |
2,331 |
2,311 |
2,212 |
| 1991 |
2,894 |
2,960 |
2,769 |
2,635 |
2,383 |
2,381 |
2,179 |
2,045 |
2,203 |
2,900 |
3,398 |
3,523 |
2,689 |
| 1992 |
4,173 |
4,388 |
3,776 |
3,435 |
3,081 |
3,050 |
2,510 |
2,004 |
2,233 |
2,971 |
2,983 |
3,056 |
3,138 |
| 1993 |
3,644 |
3,816 |
3,341 |
3,084 |
2,594 |
2,483 |
1,949 |
1,695 |
1,724 |
2,507 |
2,641 |
2,686 |
2,680 |
| 1994 |
3,397 |
3,634 |
3,282 |
2,933 |
2,617 |
2,516 |
2,390 |
1,920 |
1,819 |
2,688 |
2,546 |
2,753 |
2,708 |
| 1995 |
3,589 |
3,623 |
3,143 |
2,650 |
2,238 |
2,238 |
2,137 |
1,863 |
1,864 |
2,717 |
2,807 |
2,966 |
2,653 |
| 1996 |
3,749 |
3,987 |
3,409 |
3,163 |
2,939 |
2,768 |
2,555 |
2,145 |
2,651 |
3,293 |
3,578 |
3,524 |
3,147 |
| 1997 |
4,456 |
4,487 |
3,849 |
3,369 |
2,778 |
2,814 |
2,390 |
1,984 |
2,093 |
2,706 |
2,775 |
2,667 |
3,031 |
| 1998 |
3,009 |
2,973 |
2,531 |
2,141 |
1,855 |
2,075 |
1,657 |
1,371 |
1,630 |
2,062 |
1,994 |
2,092 |
2,116 |
| 1999 |
2,921 |
3,445 |
2,897 |
2,519 |
2,229 |
2,256 |
1,994 |
1,742 |
1,885 |
2,198 |
2,252 |
2,197 |
2,378 |
| 2000 |
2,530 |
2,575 |
2,445 |
2,138 |
1,943 |
1,843 |
1,546 |
1,556 |
1,496 |
1,671 |
1,871 |
2,019 |
1,969 |
| 2001 |
2,326 |
2,378 |
2,276 |
2,044 |
1,767 |
1,810 |
1,545 |
1,561 |
1,561 |
1,756 |
1,965 |
2,180 |
1,931 |
| 2002 |
2,978 |
3,057 |
2,932 |
2,568 |
2,380 |
2,162 |
2,288 |
2,148 |
2,397 |
2,735 |
2,614 |
3,001 |
2,605 |
| 2003 |
2,932 |
3,044 |
2,790 |
2,564 |
2,346 |
2,546 |
2,172 |
2,130 |
2,135 |
2,314 |
2,519 |
2,641 |
2,511 |
| 2004 |
2,956 |
2,969 |
2,897 |
2,508 |
2,272 |
2,419 |
2,033 |
1,956 |
1,971 |
2,129 |
2,309 |
2,429 |
2,404 |
| 2005 |
2,690 |
2,763 |
2,449 |
|
|
|
|
|
|
|
|
|
|
|


