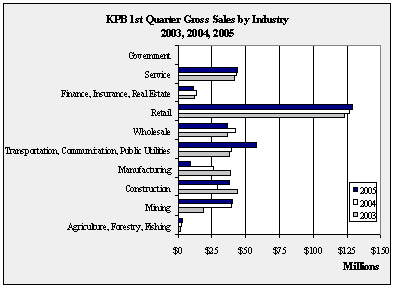
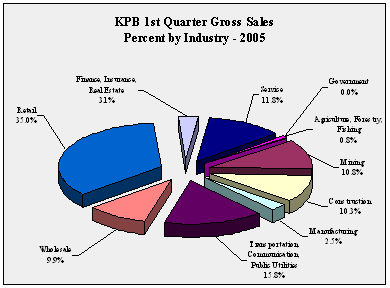
| KPB
1st Quarter Gross Sales by Industry - 1999-2005 - in $ |
| |
1999 |
2000 |
2001 |
2002 |
2003 |
2004 |
2005 |
Annual
Change |
| Agriculture,
Forestry, Fishing |
1,216,110 |
2,004,509 |
1,582,046 |
2,004,841 |
2,019,939 |
2,340,926 |
2,951,383 |
26.1% |
| Mining |
34,603,231 |
19,991,372 |
28,223,945 |
34,662,385 |
19,260,142 |
39,801,394 |
39,831,609 |
0.1% |
| Construction |
25,762,047 |
28,356,008 |
39,654,662 |
43,149,133 |
43,362,431 |
28,642,511 |
38,194,463 |
33.3% |
| Manufacturing |
25,785,276 |
25,533,587 |
48,476,583 |
21,341,761 |
38,576,448 |
26,107,055 |
9,120,078 |
-65.1% |
| Transportation,
Communication, Public Utilities |
39,046,698 |
35,887,809 |
38,441,450 |
40,723,392 |
38,217,073 |
38,967,049 |
58,281,566 |
49.6% |
| Wholesale |
30,943,744 |
33,191,801 |
35,974,922 |
37,128,746 |
35,918,425 |
41,782,771 |
36,667,868 |
-12.2% |
| Retail |
98,780,578 |
106,627,202 |
116,491,269 |
115,899,097 |
123,118,509 |
126,831,904 |
129,130,943 |
1.8% |
| Finance,
Insurance, Real Estate |
11,797,734 |
10,962,227 |
10,915,997 |
12,389,238 |
11,704,586 |
13,304,735 |
11,269,988 |
-15.3% |
| Service |
34,057,093 |
33,608,107 |
36,278,453 |
43,234,458 |
41,556,541 |
43,080,435 |
43,629,834 |
1.3% |
| Government |
12,931 |
7,487 |
6,507 |
6,700 |
12,319 |
13,663 |
15,214 |
11.4% |
| Total |
302,005,442 |
296,170,109 |
356,045,834 |
350,539,751 |
353,746,413 |
360,872,443 |
369,092,946 |
2.3% |
| Annual
Change |
|
-1.9% |
20.2% |
-1.5% |
0.9% |
2.0% |
2.3% |
|
|
KPB
1st Quarter Gross Sales Ten Year Change
by Industry - 1995 v 2005 - in $ |
| |
|
|
10
Year Change |
| |
1995 |
2005 |
Percentage |
Numerical |
| Agriculture,
Forestry, Fishing |
8,743,543 |
2,951,383 |
-66.2% |
-5,792,160 |
| Mining |
21,926,391 |
39,831,609 |
81.7% |
17,905,218 |
| Construction |
22,469,409 |
38,194,463 |
70.0% |
15,725,054 |
| Manufacturing |
33,022,502 |
9,120,078 |
-72.4% |
-23,902,424 |
| Transportation,
Communication, Public Utilities |
46,173,680 |
58,281,566 |
26.2% |
12,107,886 |
| Wholesale |
21,991,038 |
36,667,868 |
66.7% |
14,676,830 |
| Retail |
76,786,867 |
129,130,943 |
68.2% |
52,344,076 |
| Finance,
Insurance, Real Estate |
10,289,399 |
11,269,988 |
9.5% |
980,589 |
| Service |
26,033,953 |
43,629,834 |
67.6% |
17,595,881 |
| Government |
2,939 |
15,214 |
417.7% |
12,275 |
| Total |
267,439,721 |
369,092,946 |
38.0% |
101,653,225 |
|
KPB
1st Quarter Gross Sales One Year Change
by Industry - 2004 v 2005 - in $ |
| |
|
|
1
Year Change |
| |
2004 |
2005 |
Percentage |
Numerical |
| Agriculture,
Forestry, Fishing |
2,340,926 |
2,951,383 |
26.1% |
610,457 |
| Mining |
39,801,394 |
39,831,609 |
0.1% |
30,215 |
| Construction |
28,642,511 |
38,194,463 |
33.3% |
9,551,952 |
| Manufacturing |
26,107,055 |
9,120,078 |
-65.1% |
-16,986,977 |
| Transportation,
Communication, Public Utilities |
38,967,049 |
58,281,566 |
49.6% |
19,314,517 |
| Wholesale |
41,782,771 |
36,667,868 |
-12.2% |
-5,114,903 |
| Retail |
126,831,904 |
129,130,943 |
1.8% |
2,299,039 |
| Finance,
Insurance, Real Estate |
13,304,735 |
11,269,988 |
-15.3% |
-2,034,747 |
| Service |
43,080,435 |
43,629,834 |
1.3% |
549,399 |
| Government |
13,663 |
15,214 |
11.4% |
1,551 |
| Total |
360,872,443 |
369,092,946 |
2.3% |
8,220,503 |
|


