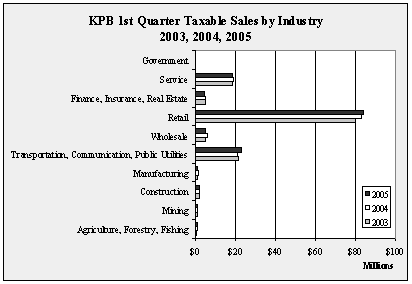
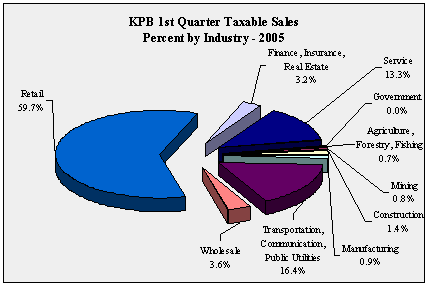
| KPB
1st Quarter Taxable Sales by Industry - 1999-2005 - in $ |
| |
1999 |
2000 |
2001 |
2002 |
2003 |
2004 |
2005 |
Annual
Change |
| Agriculture,
Forestry, Fishing |
530,805 |
643,969 |
728,231 |
796,380 |
763,045 |
889,277 |
930,189 |
4.6% |
| Mining |
765,177 |
901,499 |
1,227,851 |
1,482,601 |
1,233,618 |
1,047,668 |
1,087,830 |
3.8% |
| Construction |
1,919,966 |
1,876,702 |
1,866,887 |
2,037,148 |
2,059,743 |
2,217,009 |
2,016,842 |
-9.0% |
| Manufacturing |
1,443,187 |
1,474,956 |
1,497,558 |
1,307,744 |
1,438,887 |
1,512,130 |
1,309,950 |
-13.4% |
| Transportation,
Communication, Public Utilities |
19,449,710 |
19,206,028 |
19,320,190 |
21,573,935 |
21,650,525 |
21,021,541 |
23,066,441 |
9.7% |
| Wholesale |
4,041,316 |
4,442,855 |
4,606,145 |
4,783,261 |
5,052,561 |
5,892,430 |
5,126,430 |
-13.0% |
| Retail |
65,157,501 |
67,987,687 |
73,704,826 |
76,421,463 |
79,981,563 |
83,151,986 |
84,027,746 |
1.1% |
| Finance,
Insurance, Real Estate |
4,394,794 |
4,343,304 |
4,989,928 |
5,453,086 |
5,309,694 |
4,891,080 |
4,496,343 |
-8.1% |
| Service |
16,683,489 |
17,269,120 |
17,911,006 |
18,939,288 |
18,779,067 |
19,260,116 |
18,759,172 |
-2.6% |
| Government |
12,931 |
7,487 |
6,507 |
6,700 |
12,319 |
13,598 |
15,214 |
11.9% |
| Total |
114,398,876 |
118,153,607 |
125,859,129 |
132,801,606 |
136,281,022 |
139,896,835 |
140,836,157 |
0.7% |
| Annual
Change |
|
3.3% |
6.5% |
5.5% |
2.6% |
2.7% |
0.7% |
|
|
KPB
1st Quarter Taxable Sales Ten Year Change
by Industry - 1995 v 2005 - in $ |
| |
|
|
10
Year Change |
| |
1995 |
2005 |
Percentage |
Numerical |
| Agriculture,
Forestry, Fishing |
499,391 |
930,189 |
86.3% |
430,798 |
| Mining |
950,309 |
1,087,830 |
14.5% |
137,521 |
| Construction |
1,550,793 |
2,016,842 |
30.1% |
466,049 |
| Manufacturing |
1,335,690 |
1,309,950 |
-1.9% |
-25,740 |
| Transportation,
Communication, Public Utilities |
16,049,034 |
23,066,441 |
43.7% |
7,017,407 |
| Wholesale |
4,494,650 |
5,126,430 |
14.1% |
631,780 |
| Retail |
55,409,164 |
84,027,746 |
51.6% |
28,618,582 |
| Finance,
Insurance, Real Estate |
4,301,030 |
4,496,343 |
4.5% |
195,313 |
| Service |
14,507,045 |
18,759,172 |
29.3% |
4,252,127 |
| Government |
2,939 |
15,214 |
417.7% |
12,275 |
| Total |
99,100,045 |
140,836,157 |
42.1% |
41,736,112 |
|
KPB
1st Quarter Taxable Sales One Year Change
by Industry - 2004 v 2005 - in $ |
| |
|
|
1
Year Change |
| |
2004 |
2005 |
Percentage |
Numerical |
| Agriculture,
Forestry, Fishing |
889,277 |
930,189 |
4.6% |
40,912 |
| Mining |
1,047,668 |
1,087,830 |
3.8% |
40,162 |
| Construction |
2,217,009 |
2,016,842 |
-9.0% |
-200,167 |
| Manufacturing |
1,512,130 |
1,309,950 |
-13.4% |
-202,180 |
| Transportation,
Communication, Public Utilities |
21,021,541 |
23,066,441 |
9.7% |
2,044,900 |
| Wholesale |
5,892,430 |
5,126,430 |
-13.0% |
-766,000 |
| Retail |
83,151,986 |
84,027,746 |
1.1% |
875,760 |
| Finance,
Insurance, Real Estate |
4,891,080 |
4,496,343 |
-8.1% |
-394,737 |
| Service |
19,260,116 |
18,759,172 |
-2.6% |
-500,944 |
| Government |
13,598 |
15,214 |
11.9% |
1,616 |
| Total |
139,896,835 |
140,836,157 |
0.7% |
939,322 |
|


