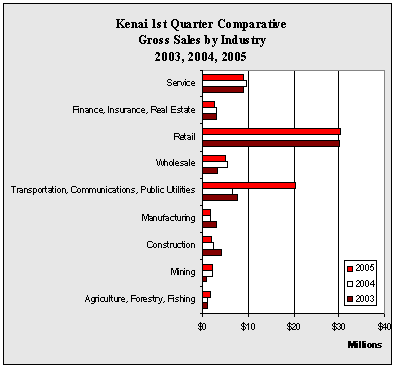
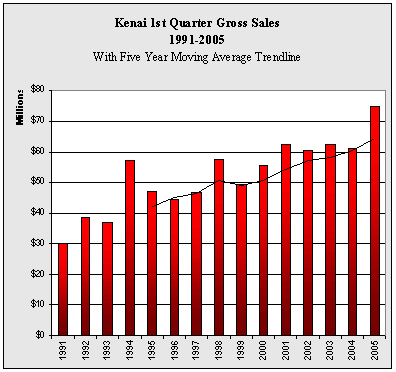
| Kenai
1st Quarter Gross Sales by Industry - 1999-2005 - in $ |
| |
1999 |
2000 |
2001 |
2002 |
2003 |
2004 |
2005 |
Annual
Change |
| Agriculture,
Forestry, Fishing |
629,110 |
1,289,933 |
633,357 |
1,170,314 |
1,002,650 |
1,061,786 |
1,613,553 |
52.0% |
| Mining |
37,476 |
1,537,438 |
852,594 |
2,214,717 |
942,570 |
2,011,733 |
2,243,621 |
11.5% |
| Construction |
3,055,890 |
3,678,541 |
1,914,204 |
3,777,071 |
4,115,296 |
2,314,222 |
1,901,453 |
-17.8% |
| Manufacturing |
1,475,182 |
2,268,724 |
2,808,918 |
2,256,153 |
2,997,006 |
1,610,022 |
1,676,345 |
4.1% |
| Transportation,
Communications, Public Utilities |
6,364,713 |
6,312,579 |
6,078,860 |
6,416,059 |
7,714,369 |
6,489,016 |
20,301,148 |
212.9% |
| Wholesale |
1,912,703 |
2,723,434 |
4,987,946 |
3,364,888 |
3,221,739 |
5,349,782 |
4,968,831 |
-7.1% |
| Retail |
27,061,077 |
27,945,524 |
34,150,036 |
28,474,145 |
30,107,230 |
29,814,280 |
30,440,005 |
2.1% |
| Finance,
Insurance, Real Estate |
2,650,247 |
2,518,820 |
2,962,348 |
3,439,155 |
3,050,602 |
2,864,673 |
2,536,399 |
-11.5% |
| Service |
6,123,394 |
7,334,383 |
8,030,023 |
9,483,867 |
8,988,895 |
9,556,990 |
8,905,923 |
-6.8% |
| Government |
105 |
200 |
0 |
0 |
0 |
0 |
0 |
NA
|
| Total |
49,309,897 |
55,609,576 |
62,418,286 |
60,596,369 |
62,140,357 |
61,072,504 |
74,587,278 |
22.1% |
| Annual
Change |
|
12.8% |
12.2% |
-2.9% |
2.5% |
-1.7% |
22.1% |
|
|


