| Kenai
1st Quarter Taxable Sales by Industry - 1999-2005 - in $ |
| |
1999 |
2000 |
2001 |
2002 |
2003 |
2004 |
2005 |
Annual
Change |
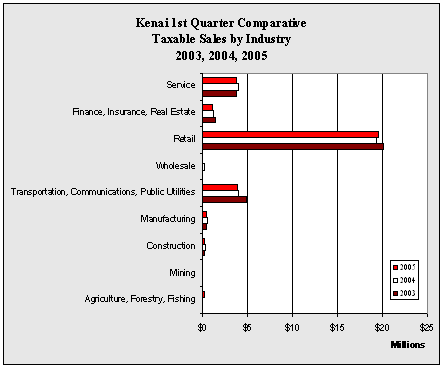
| Agriculture,
Forestry, Fishing |
99,230 |
79,672 |
88,262 |
90,609 |
87,894 |
97,275 |
141,622 |
45.6% |
| Mining |
7,264 |
30,513 |
58,812 |
51,370 |
34,119 |
63,827 |
70,218 |
10.0% |
| Construction |
257,031 |
234,824 |
237,187 |
248,573 |
242,193 |
270,414 |
192,533 |
-28.8% |
| Manufacturing |
356,148 |
436,177 |
437,740 |
349,360 |
441,292 |
508,762 |
434,079 |
-14.7% |
| Transportation,
Communications, Public Utilities |
3,587,280 |
3,661,405 |
3,398,397 |
3,779,839 |
4,932,006 |
3,939,435 |
3,890,462 |
-1.2% |
| Wholesale |
168,481 |
182,229 |
179,452 |
107,790 |
79,538 |
152,309 |
90,018 |
-40.9% |
| Retail |
16,109,907 |
16,163,284 |
18,137,349 |
18,685,738 |
20,062,767 |
19,316,910 |
19,538,827 |
1.1% |
| Finance,
Insurance, Real Estate |
1,204,578 |
1,230,731 |
1,527,679 |
1,645,401 |
1,480,683 |
1,256,343 |
1,107,224 |
-11.9% |
| Service |
3,393,873 |
3,502,478 |
3,824,363 |
3,979,662 |
3,732,984 |
3,940,716 |
3,771,696 |
-4.3% |
| Government |
105 |
200 |
0 |
0 |
0 |
0 |
0 |
NA |
| Total |
25,183,897 |
25,521,513 |
27,889,241 |
28,938,342 |
31,093,476 |
29,545,991 |
29,236,679 |
-1.0% |
| Annual
Change |
|
1.3% |
9.3% |
3.8% |
7.4% |
-5.0% |
-1.0% |
|
|