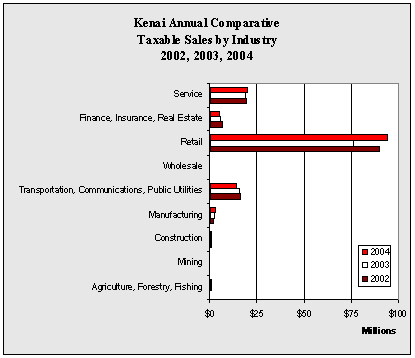
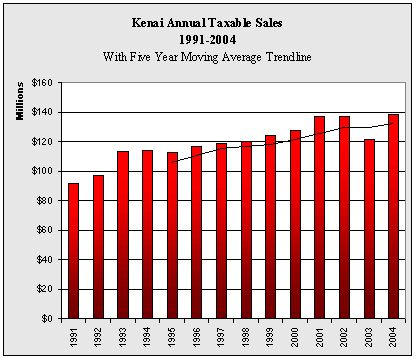
| Kenai
Annual Taxable Sales by Industry - 1998-2004 - in $ |
| |
1998 |
1999 |
2000 |
2001 |
2002 |
2003 |
2004 |
Annual
Change |
| Agriculture,
Forestry, Fishing |
448,689 |
513,026 |
518,603 |
505,615 |
505,614 |
559,313 |
718,415 |
28.4% |
| Mining |
49,522 |
96,651 |
166,846 |
223,196 |
213,971 |
192,718 |
262,963 |
36.4% |
| Construction |
1,200,303 |
1,180,607 |
1,085,964 |
1,171,924 |
1,111,101 |
1,172,308 |
1,146,165 |
-2.2% |
| Manufacturing |
2,140,912 |
2,085,657 |
2,450,721 |
2,238,645 |
2,218,515 |
2,451,929 |
2,853,082 |
16.4% |
| Transportation,
Communications, Public Utilities |
12,899,378 |
15,330,911 |
13,458,834 |
13,192,948 |
16,120,066 |
15,890,944 |
14,094,256 |
-11.3% |
| Wholesale |
877,088 |
829,682 |
898,759 |
727,784 |
517,025 |
494,254 |
473,716 |
-4.2% |
| Retail |
80,814,442 |
81,828,974 |
85,347,467 |
93,226,651 |
90,195,938 |
76,153,080 |
94,195,956 |
23.7% |
| Finance,
Insurance, Real Estate |
4,918,254 |
4,824,067 |
5,718,387 |
6,757,340 |
6,600,246 |
5,601,342 |
5,209,124 |
-7.0% |
| Service |
16,680,181 |
17,677,101 |
18,120,257 |
18,998,608 |
19,287,134 |
18,796,331 |
19,673,769 |
4.7% |
| Government |
1,938 |
415 |
288 |
1,213 |
0 |
0 |
0 |
NA |
| Total |
120,030,707 |
124,367,091 |
127,766,126 |
137,043,924 |
136,769,610 |
121,312,219 |
138,627,446 |
14.3% |
| Annual
Change |
|
3.6% |
2.7% |
7.3% |
-0.2% |
-11.3% |
14.3% |
|
|


