| Seldovia
1st Quarter Gross Sales by Industry - 1999-2005 - in $ |
| |
1999 |
2000 |
2001 |
2002 |
2003 |
2004 |
2005 |
Annual
Change |
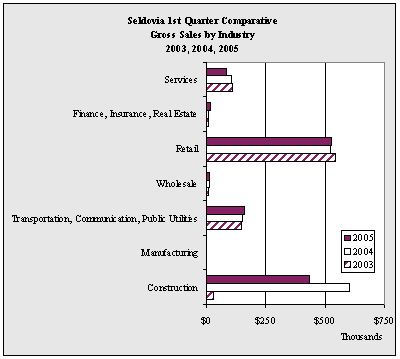
| Construction |
12,261 |
46,844 |
30,023 |
66,782 |
27,947 |
601,376 |
433,991 |
-27.8% |
| Manufacturing |
3,227 |
3,729 |
2,989 |
1,704 |
1,845 |
1,249 |
1,331 |
6.6% |
| Transportation,
Communication, Public Utilities |
188,073 |
159,367 |
162,024 |
163,245 |
147,749 |
151,748 |
160,989 |
6.1% |
| Wholesale |
254,537 |
16,761 |
25,686 |
3,760 |
9,201 |
14,150 |
12,898 |
-8.8% |
| Retail |
312,303 |
807,661 |
553,396 |
485,479 |
544,320 |
522,637 |
524,567 |
0.4% |
| Finance,
Insurance, Real Estate |
38,117 |
14,063 |
23,824 |
158,668 |
7,090 |
9,127 |
16,009 |
75.4% |
| Services |
99,540 |
102,267 |
100,869 |
132,074 |
108,853 |
104,760 |
85,899 |
-18.0% |
| Total |
908,058 |
1,150,692 |
898,811 |
1,011,712 |
847,005 |
1,405,047 |
1,235,684 |
-12.1% |
Annual
Change |
|
26.7% |
-21.9% |
12.6% |
-16.3% |
65.9% |
-12.1% |
|
|