| Seldovia
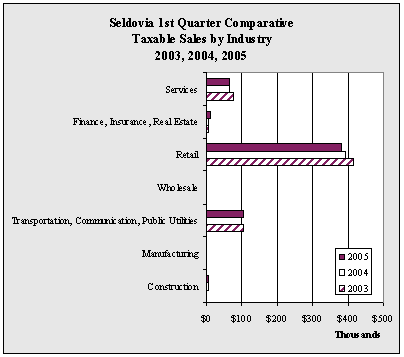
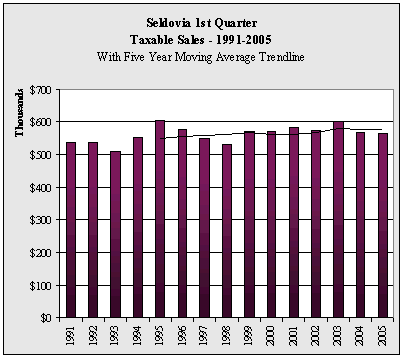
1st Quarter Taxable Sales by Industry - 1999-2005 - in $ |
| |
1999 |
2000 |
2001 |
2002 |
2003 |
2004 |
2005 |
Annual
Change |
| Construction |
4,361 |
9,989 |
7,595 |
6,980 |
1,131 |
5,160 |
4,155 |
-19.5% |
| Manufacturing |
1,078 |
1,709 |
1,054 |
1,194 |
368 |
649 |
831 |
28.0% |
| Transportation,
Communication, Public Utilities |
113,032 |
110,305 |
117,188 |
115,021 |
103,692 |
96,989 |
102,157 |
5.3% |
| Wholesale |
97,835 |
1,003 |
250 |
159 |
150 |
30 |
75 |
150.0% |
| Retail |
275,795 |
369,861 |
392,049 |
367,416 |
415,056 |
392,241 |
381,255 |
-2.8% |
| Finance,
Insurance, Real Estate |
18,037 |
8,593 |
6,389 |
7,178 |
4,600 |
5,942 |
11,204 |
88.6% |
| Services |
59,300 |
67,633 |
59,030 |
75,676 |
73,973 |
65,715 |
64,083 |
-2.5% |
| Total |
569,438 |
569,093 |
583,555 |
573,624 |
598,970 |
566,726 |
563,760 |
-0.5% |
| Annual
Change |
|
-0.1% |
2.5% |
-1.7% |
4.4% |
-5.4% |
-0.5% |
|
|


