| Seward
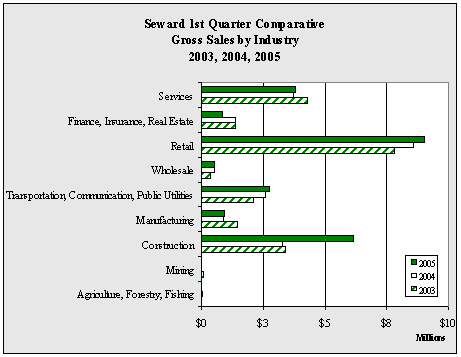
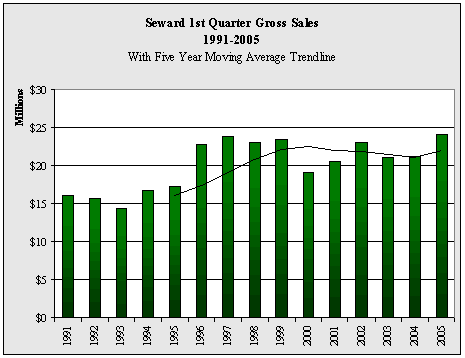
1st Quarter Gross Sales by Industry - 1999-2005 - in $ |
| |
1999 |
2000 |
2001 |
2002 |
2003 |
2004 |
2005 |
Annual
Change |
| Agriculture,
Forestry, Fishing |
42,770 |
29,612 |
27,525 |
20,810 |
35,450 |
54,549 |
30,789 |
-43.6% |
| Mining |
67,649 |
102,213 |
63,891 |
48,952 |
67,921 |
24,996 |
32,647 |
30.6% |
| Construction |
3,859,640 |
2,142,805 |
3,865,008 |
3,040,364 |
3,401,454 |
3,306,762 |
6,127,292 |
85.3% |
| Manufacturing |
811,226 |
903,176 |
2,314,947 |
1,974,606 |
1,468,277 |
892,586 |
939,970 |
5.3% |
| Transportation,
Communication, Public Utilities |
2,188,096 |
1,926,386 |
2,321,975 |
2,253,103 |
2,084,901 |
2,592,442 |
2,741,108 |
5.7% |
| Wholesale |
1,051,496 |
378,036 |
361,455 |
386,897 |
385,079 |
544,648 |
520,186 |
-4.5% |
| Retail |
7,450,620 |
8,152,343 |
6,972,958 |
7,932,221 |
7,796,709 |
8,616,690 |
9,025,663 |
4.7% |
| Finance,
Insurance, Real Estate |
1,904,649 |
1,966,455 |
1,089,430 |
1,790,625 |
1,394,159 |
1,407,043 |
860,232 |
-38.9% |
| Services |
5,980,741 |
3,486,771 |
3,514,083 |
5,506,435 |
4,299,310 |
3,726,982 |
3,809,268 |
2.2% |
| Government |
0 |
0 |
0 |
0 |
0 |
0 |
0 |
NA
|
| Total |
23,356,887 |
19,087,797 |
20,531,272 |
22,954,013 |
20,933,260 |
21,166,698 |
24,087,155 |
13.8% |
| Annual
Change |
|
-18.3% |
7.6% |
11.8% |
-8.8% |
1.1% |
13.8% |
|
|


