| Seward
1st Quarter Taxable Sales by Industry - 1999-2005 - in $ |
| |
1999 |
2000 |
2001 |
2002 |
2003 |
2004 |
2005 |
Annual
Change |
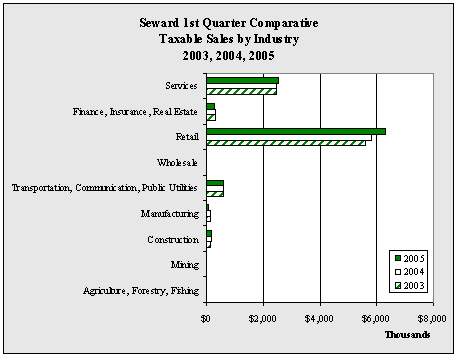
| Agriculture,
Forestry, Fishing |
6,422 |
11,504 |
3,990 |
6,729 |
11,673 |
11,923 |
8,489 |
-28.8% |
| Mining |
1,444 |
0 |
0 |
0 |
0 |
0 |
0 |
NA |
| Construction |
165,176 |
154,446 |
130,066 |
128,807 |
126,874 |
167,430 |
151,989 |
-9.2% |
| Manufacturing |
152,135 |
142,706 |
124,810 |
115,801 |
144,853 |
131,626 |
79,282 |
-39.8% |
| Transportation,
Communication, Public Utilities |
699,556 |
738,521 |
652,774 |
560,857 |
588,465 |
581,778 |
583,500 |
0.3% |
| Wholesale |
21,666 |
25,528 |
29,309 |
12,026 |
15,297 |
23,473 |
13,977 |
-40.5% |
| Retail |
5,309,599 |
5,369,566 |
5,326,126 |
5,387,940 |
5,598,838 |
5,826,218 |
6,305,957 |
8.2% |
| Finance,
Insurance, Real Estate |
368,278 |
337,316 |
363,832 |
354,630 |
330,069 |
295,698 |
261,416 |
-11.6% |
| Services |
2,494,402 |
2,594,773 |
2,442,586 |
2,484,254 |
2,473,272 |
2,455,335 |
2,538,939 |
3.4% |
| Government |
0 |
0 |
0 |
0 |
0 |
0 |
0 |
NA
|
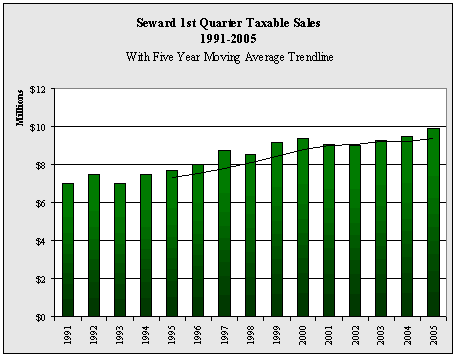
| Total |
9,218,678 |
9,374,360 |
9,073,493 |
9,051,044 |
9,289,341 |
9,493,481 |
9,943,549 |
4.7% |
| Annual
Change |
|
1.7% |
-3.2% |
-0.2% |
2.6% |
2.2% |
4.7% |
|
|