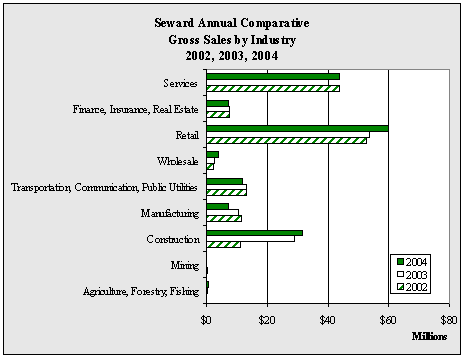
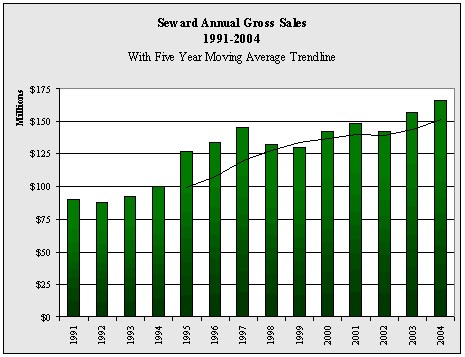
| Seward
Annual Gross Sales by Industry - 1998-2004 - in $ |
| |
1998 |
1999 |
2000 |
2001 |
2002 |
2003 |
2004 |
Annual
Change |
| Agriculture,
Forestry, Fishing |
472,717 |
414,123 |
689,481 |
437,640 |
298,046 |
489,097 |
651,718 |
33.2% |
| Mining |
229,681 |
332,546 |
405,115 |
330,859 |
377,441 |
189,755 |
228,403 |
20.4% |
| Construction |
19,183,104 |
12,588,992 |
16,255,816 |
21,082,426 |
11,084,304 |
28,881,212 |
31,490,526 |
9.0% |
| Manufacturing |
4,266,551 |
4,895,971 |
9,541,307 |
12,023,577 |
11,540,635 |
10,446,881 |
7,214,583 |
-30.9% |
| Transportation,
Communication, Public Utilities |
13,656,791 |
12,011,182 |
14,705,875 |
12,840,952 |
13,026,323 |
12,969,855 |
11,702,893 |
-9.8% |
| Wholesale |
7,270,151 |
3,064,525 |
2,339,175 |
2,231,731 |
2,208,659 |
2,600,579 |
3,953,585 |
52.0% |
| Retail |
44,656,247 |
48,356,132 |
51,460,505 |
50,408,318 |
52,600,754 |
53,593,021 |
60,041,140 |
12.0% |
| Finance,
Insurance, Real Estate |
8,498,546 |
9,458,188 |
8,394,110 |
6,333,381 |
7,595,826 |
7,557,129 |
7,207,271 |
-4.6% |
| Services |
34,272,460 |
39,033,862 |
38,360,895 |
42,671,669 |
43,635,138 |
40,232,069 |
43,645,529 |
8.5% |
| Government |
0 |
0 |
0 |
0 |
0 |
0 |
0 |
NA
|
| Total |
132,506,248 |
130,155,521 |
142,152,279 |
148,360,553 |
142,367,126 |
156,959,598 |
166,135,648 |
5.8% |
| Annual
Change |
|
-1.8% |
9.2% |
4.4% |
-4.0% |
10.2% |
5.8% |
|
|


