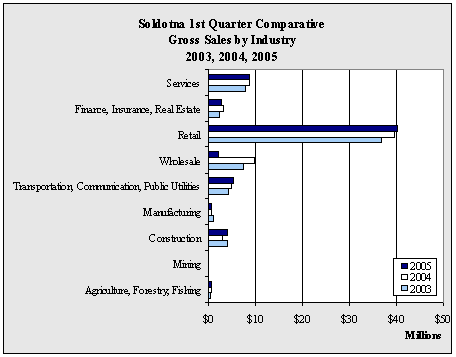
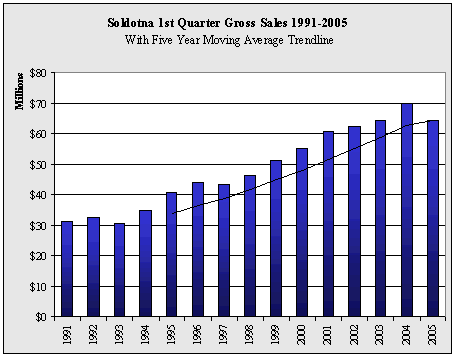
| Soldotna
1st Quarter Gross Sales by Industry - 1999-2005 - in $ |
| |
1999 |
2000 |
2001 |
2002 |
2003 |
2004 |
2005 |
Annual
Change |
| Agriculture,
Forestry, Fishing |
97,954 |
158,182 |
215,220 |
231,354 |
287,421 |
556,985 |
577,172 |
3.6% |
| Mining |
47,052 |
71,262 |
49,472 |
98,101 |
110,629 |
92,181 |
90,039 |
-2.3% |
| Construction |
2,307,621 |
3,044,411 |
4,015,371 |
3,228,042 |
3,997,918 |
2,956,843 |
4,089,120 |
38.3% |
| Manufacturing |
481,304 |
641,545 |
967,938 |
900,894 |
1,129,391 |
543,783 |
513,059 |
-5.7% |
| Transportation,
Communication, Public Utilities |
3,991,637 |
4,039,609 |
4,764,455 |
3,685,725 |
4,211,327 |
4,796,956 |
5,315,503 |
10.8% |
| Wholesale |
5,799,487 |
7,278,779 |
6,827,062 |
8,072,050 |
7,309,289 |
9,720,151 |
2,084,468 |
-78.6% |
| Retail |
30,513,785 |
31,528,136 |
34,715,249 |
36,487,247 |
36,787,701 |
39,606,915 |
40,334,405 |
1.8% |
| Finance,
Insurance, Real Estate |
2,100,160 |
1,976,395 |
2,166,881 |
2,258,203 |
2,461,298 |
3,032,921 |
2,707,082 |
-10.7% |
| Services |
6,078,154 |
6,456,290 |
7,074,122 |
7,363,434 |
7,926,425 |
8,597,849 |
8,646,908 |
0.6% |
| Government |
12,826 |
7,287 |
6,507 |
6,700 |
12,319 |
6,904 |
1,897 |
-72.5% |
| Total |
51,429,980 |
55,201,896 |
60,802,277 |
62,331,750 |
64,233,718 |
69,911,488 |
64,359,653 |
-7.9% |
| Annual
Change |
|
7.3% |
10.1% |
2.5% |
3.1% |
8.8% |
-7.9% |
|
|


