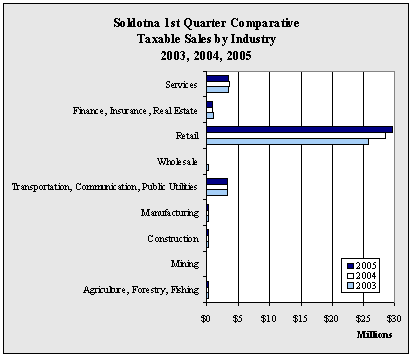
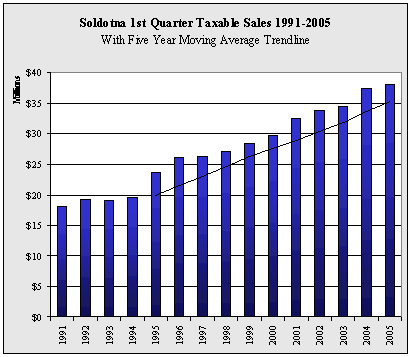
| Soldotna
1st Quarter Taxable Sales by Industry - 1999-2005 - in $ |
| |
1999 |
2000 |
2001 |
2002 |
2003 |
2004 |
2005 |
Annual
Change |
| Agriculture,
Forestry, Fishing |
94,556 |
148,104 |
183,856 |
185,252 |
167,593 |
219,231 |
179,414 |
-18.2% |
| Mining |
0 |
1,148 |
7,612 |
6,447 |
9,374 |
6,675 |
6,145 |
-7.9% |
| Construction |
295,263 |
316,000 |
234,518 |
283,099 |
301,760 |
316,960 |
327,458 |
3.3% |
| Manufacturing |
199,670 |
194,558 |
199,966 |
181,486 |
219,705 |
197,841 |
199,659 |
0.9% |
| Transportation,
Communication, Public Utilities |
2,544,919 |
2,608,749 |
2,584,193 |
2,752,273 |
3,219,035 |
3,338,198 |
3,298,150 |
-1.2% |
| Wholesale |
59,914 |
71,213 |
124,637 |
135,437 |
173,053 |
154,053 |
117,758 |
-23.6% |
| Retail |
21,325,306 |
22,423,668 |
25,030,145 |
25,570,526 |
25,769,374 |
28,539,627 |
29,559,836 |
3.6% |
| Finance,
Insurance, Real Estate |
858,013 |
860,411 |
1,072,034 |
1,170,633 |
1,141,419 |
961,092 |
951,012 |
-1.0% |
| Services |
3,049,461 |
3,033,282 |
3,048,909 |
3,444,755 |
3,449,990 |
3,642,747 |
3,430,305 |
-5.8% |
| Government |
12,826 |
7,287 |
6,507 |
6,700 |
12,319 |
6,904 |
1,897 |
-72.5% |
| Total |
28,439,928 |
29,664,420 |
32,492,377 |
33,736,608 |
34,463,622 |
37,383,328 |
38,071,634 |
1.8% |
Annual
Change |
|
4.3% |
9.5% |
3.8% |
2.2% |
8.5% |
1.8% |
|
|


