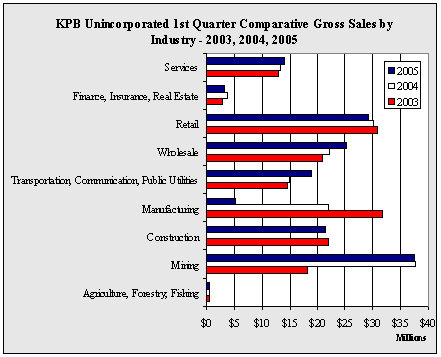
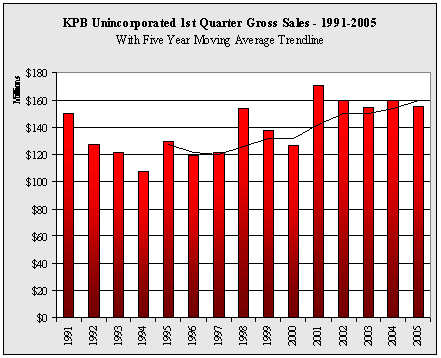
| KPB
Unincorporated 1st Quarter Gross Sales by Industry - 1999-2005 - in $ |
| |
1999 |
2000 |
2001 |
2002 |
2003 |
2004 |
2005 |
Annual
Change |
| Agriculture,
Forestry, Fishing |
352,211 |
352,282 |
545,478 |
447,651 |
445,085 |
438,254 |
465,423 |
6.2% |
| Mining |
34,450,859 |
18,280,459 |
27,248,851 |
32,299,252 |
18,139,022 |
37,672,228 |
37,465,302 |
-0.5% |
| Construction |
10,514,866 |
12,148,240 |
21,706,616 |
24,605,950 |
22,024,293 |
15,137,343 |
21,389,579 |
41.3% |
| Manufacturing |
19,503,745 |
19,962,580 |
41,056,398 |
14,954,570 |
31,662,293 |
21,943,272 |
5,263,442 |
-76.0% |
| Transportation,
Communication, Public Utilities |
18,000,772 |
15,686,890 |
16,720,929 |
18,420,972 |
14,598,070 |
14,959,439 |
18,894,611 |
26.3% |
| Wholesale |
17,788,353 |
19,617,188 |
20,272,119 |
21,943,141 |
20,948,522 |
22,031,868 |
25,153,252 |
14.2% |
| Retail |
22,158,531 |
25,988,141 |
27,173,506 |
28,752,133 |
30,773,844 |
30,043,965 |
29,210,862 |
-2.8% |
| Finance,
Insurance, Real Estate |
3,147,542 |
3,038,933 |
3,268,311 |
3,214,862 |
2,801,512 |
3,743,613 |
3,153,580 |
-15.8% |
| Services |
11,530,093 |
11,590,268 |
12,558,002 |
14,742,430 |
12,971,156 |
13,197,994 |
14,061,176 |
6.5% |
| Government |
0 |
0 |
0 |
0 |
0 |
6,365 |
13,317 |
109.2% |
| Total |
137,446,972 |
126,664,981 |
170,550,210 |
159,380,961 |
154,363,797 |
159,174,341 |
155,070,544 |
-2.6% |
| Annual
Change |
|
-7.8% |
34.6% |
-6.5% |
-3.1% |
3.1% |
-2.6% |
|
|


