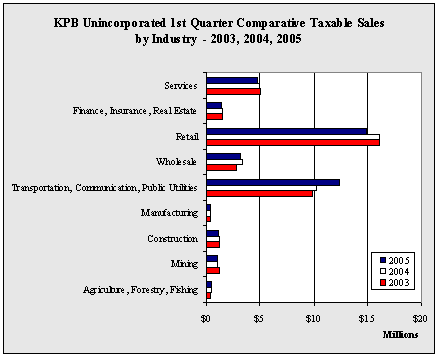
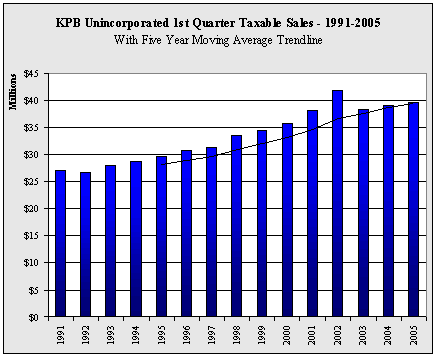
| KPB Unincorporated 1st Quarter Taxable Sales by Industry -
1999-2005 - in $ |
| |
1999 |
2000 |
2001 |
2002 |
2003 |
2004 |
2005 |
Annual
Change |
| Agriculture,
Forestry, Fishing |
250,732 |
296,108 |
343,834 |
396,517 |
360,151 |
402,891 |
419,213 |
4.1% |
| Mining |
756,274 |
869,838 |
1,159,787 |
1,424,074 |
1,190,125 |
977,166 |
1,011,467 |
3.5% |
| Construction |
1,016,102 |
946,521 |
1,078,729 |
1,132,055 |
1,144,439 |
1,180,160 |
1,120,998 |
-5.0% |
| Manufacturing |
389,123 |
347,573 |
408,113 |
396,651 |
355,143 |
367,901 |
383,507 |
4.2% |
| Transportation,
Communication, Public Utilities |
10,204,126 |
9,905,033 |
10,437,988 |
12,140,823 |
9,916,712 |
10,258,635 |
12,356,091 |
20.4% |
| Wholesale |
2,182,510 |
2,513,184 |
2,580,662 |
2,865,394 |
2,773,715 |
3,328,186 |
3,214,145 |
-3.4% |
| Retail |
13,321,220 |
14,473,470 |
15,269,638 |
16,309,155 |
16,136,823 |
16,098,232 |
14,950,250 |
-7.1% |
| Finance,
Insurance, Real Estate |
1,284,648 |
1,230,682 |
1,327,960 |
1,506,676 |
1,452,777 |
1,481,302 |
1,338,749 |
-9.6% |
| Services |
4,943,733 |
5,113,952 |
5,448,548 |
5,633,539 |
5,055,788 |
4,980,414 |
4,768,229 |
-4.3% |
| Government |
0 |
0 |
0 |
0 |
0 |
6,300 |
13,317 |
111.4% |
| Total |
34,348,468 |
35,696,361 |
38,055,259 |
41,804,884 |
38,385,673 |
39,081,187 |
39,575,966 |
1.3% |
| Annual
Change |
|
3.9% |
6.6% |
9.9% |
-8.2% |
1.8% |
1.3% |
|
|


