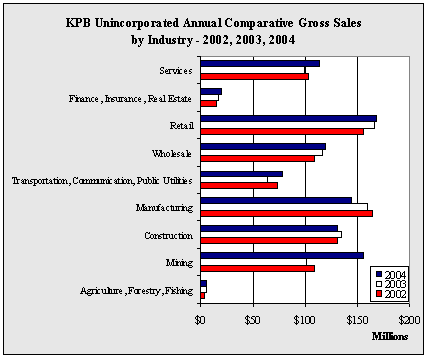
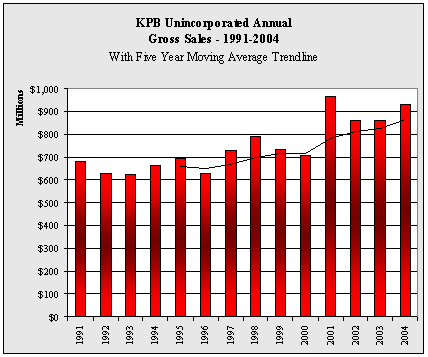
| KPB
Unincorporated Annual Gross Sales by Industry - 1998-2004 - in $ |
| |
1998 |
1999 |
2000 |
2001 |
2002 |
2003 |
2004 |
Annual
Change |
| Agriculture,
Forestry, Fishing |
6,119,386 |
2,812,823 |
2,875,629 |
3,242,403 |
4,090,590 |
4,814,409 |
5,857,634 |
21.7% |
| Mining |
187,521,559 |
113,163,554 |
115,625,431 |
123,091,789 |
108,808,400 |
101,004,267 |
155,698,225 |
54.2% |
| Construction |
88,142,507 |
87,808,495 |
88,853,048 |
136,499,774 |
131,261,695 |
133,897,211 |
130,443,722 |
-2.6% |
| Manufacturing |
112,671,455 |
132,512,994 |
85,638,574 |
250,593,511 |
164,076,655 |
159,471,272 |
143,966,955 |
-9.7% |
| Transportation,
Communication, Public Utilities |
73,567,609 |
78,647,818 |
66,837,538 |
77,388,092 |
73,138,015 |
63,786,231 |
78,102,991 |
22.4% |
| Wholesale |
101,466,620 |
91,041,042 |
101,310,365 |
104,710,505 |
108,334,825 |
115,986,698 |
119,012,626 |
2.6% |
| Retail |
128,963,750 |
128,644,968 |
138,967,225 |
153,029,767 |
155,130,975 |
166,755,991 |
167,783,923 |
0.6% |
| Finance,
Insurance, Real Estate |
15,909,441 |
15,194,140 |
13,106,195 |
15,680,221 |
14,436,076 |
16,408,311 |
19,316,392 |
17.7% |
| Services |
78,651,481 |
83,322,595 |
95,090,680 |
100,412,737 |
102,659,177 |
98,547,914 |
113,281,658 |
15.0% |
| Government |
6,585 |
0 |
0 |
0 |
0 |
0 |
13,732 |
NA
|
| Total |
793,020,393 |
733,148,429 |
708,304,685 |
964,648,799 |
861,936,408 |
860,672,304 |
933,477,858 |
8.5% |
| Annual
Change |
|
-7.5% |
-3.4% |
36.2% |
-10.6% |
-0.1% |
8.5% |
|
|


