| KPB
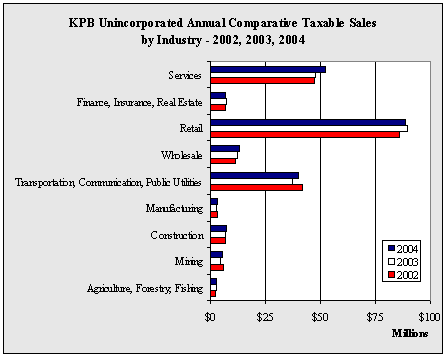
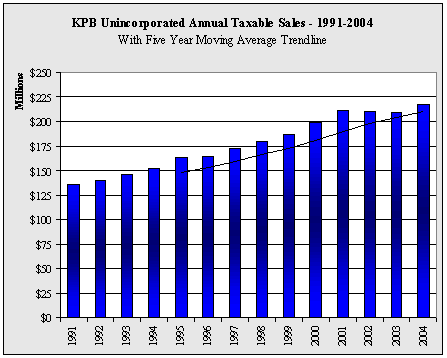
Unincorporated Annual Taxable Sales by Industry - 1998-2004 - in $ |
| |
1998 |
1999 |
2000 |
2001 |
2002 |
2003 |
2004 |
Annual
Change |
| Agriculture,
Forestry, Fishing |
1,722,929 |
1,738,057 |
1,945,844 |
2,016,782 |
2,152,460 |
2,281,300 |
2,540,907 |
11.4% |
| Mining |
5,144,815 |
3,724,685 |
4,434,095 |
5,598,954 |
5,598,990 |
4,655,675 |
5,218,907 |
12.1% |
| Construction |
5,738,513 |
5,621,785 |
5,735,340 |
6,115,447 |
6,566,858 |
6,601,200 |
6,787,853 |
2.8% |
| Manufacturing |
3,388,424 |
3,021,658 |
3,084,591 |
3,041,030 |
2,944,959 |
2,626,320 |
2,872,144 |
9.4% |
| Transportation,
Communication, Public Utilities |
35,992,074 |
39,160,283 |
39,092,526 |
42,147,135 |
41,606,993 |
37,098,365 |
40,099,801 |
8.1% |
| Wholesale |
8,733,322 |
9,868,388 |
11,100,421 |
11,675,046 |
11,425,901 |
12,058,985 |
12,952,451 |
7.4% |
| Retail |
72,533,481 |
75,119,590 |
80,838,970 |
85,853,411 |
86,150,313 |
89,695,084 |
88,824,823 |
-1.0% |
| Finance,
Insurance, Real Estate |
5,494,477 |
5,585,421 |
5,678,461 |
6,363,047 |
6,509,160 |
7,017,830 |
6,664,257 |
-5.0% |
| Services |
40,794,714 |
43,554,212 |
47,432,032 |
48,734,123 |
47,390,646 |
47,504,072 |
52,072,433 |
9.6% |
| Government |
6,585 |
0 |
0 |
0 |
0 |
0 |
13,667 |
NA |
| Total |
179,549,334 |
187,394,079 |
199,342,280 |
211,544,975 |
210,346,280 |
209,538,831 |
218,047,243 |
4.1% |
| Annual
Change |
|
4.4% |
6.4% |
6.1% |
-0.6% |
-0.4% |
4.1% |
|
|


