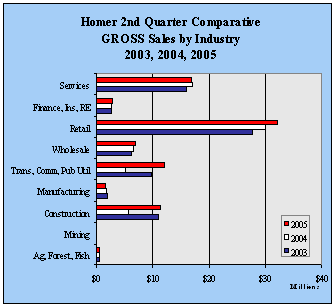
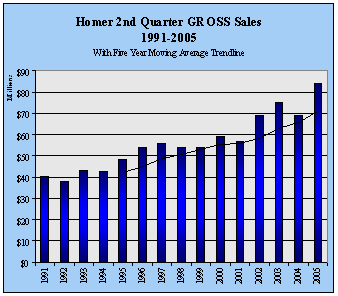
| Homer 2nd
Quarter GROSS Sales by Industry - 1999-2005 - in $ |
| |
1999 |
2000 |
2001 |
2002 |
2003 |
2004 |
2005 |
Annual
Change |
| Ag,
Forest, Fish |
297,282 |
615,776 |
221,357 |
250,389 |
420,146 |
430,095 |
518,297 |
20.5% |
| Mining |
0 |
0 |
1,844 |
3,836 |
0 |
104 |
15,410 |
14717.3% |
| Construction |
5,877,294 |
11,808,767 |
6,727,125 |
7,437,731 |
11,071,038 |
5,685,550 |
11,383,064 |
100.2% |
| Manufacturing |
4,737,214 |
1,939,037 |
1,455,193 |
1,790,421 |
1,899,935 |
1,807,647 |
1,542,572 |
-14.7% |
| Trans,
Comm, Pub Util |
8,239,713 |
8,584,067 |
8,926,617 |
10,982,097 |
9,778,534 |
5,034,111 |
12,073,884 |
139.8% |
| Wholesale |
4,606,377 |
4,452,048 |
5,204,028 |
5,360,132 |
6,092,813 |
6,421,737 |
6,881,765 |
7.2% |
| Retail |
18,330,887 |
19,883,252 |
20,975,149 |
24,997,009 |
27,557,784 |
30,021,416 |
32,195,201 |
7.2% |
| Finance,
Ins, RE |
1,917,870 |
1,686,154 |
1,982,111 |
2,046,589 |
2,547,744 |
2,619,310 |
2,737,927 |
4.5% |
| Services |
9,864,551 |
10,318,481 |
11,364,051 |
15,803,541 |
15,919,950 |
16,958,505 |
16,944,932 |
-0.1% |
| Government |
53,871,188 |
59,287,582 |
56,857,475 |
68,671,745 |
75,287,944 |
68,978,475 |
84,293,052 |
22.2% |
| Annual
Change |
|
10.1% |
-4.1% |
20.8% |
9.6% |
-8.4% |
22.2% |
|
|


