| Homer 2nd
Quarter TAXABLE Sales by Industry - 1999-2005 - in $ |
| |
1999 |
2000 |
2001 |
2002 |
2003 |
2004 |
2005 |
Annual
Change |
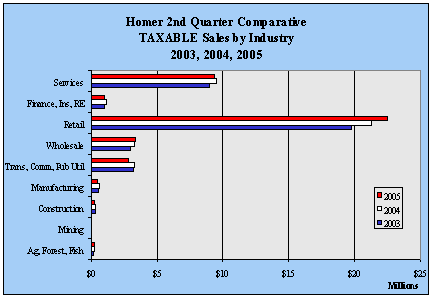
| Ag,
Forest, Fish |
119,513 |
134,398 |
146,035 |
166,982 |
212,539 |
247,630 |
236,684 |
-4.4% |
| Mining |
0 |
0 |
1,549 |
1,955 |
0 |
104 |
0 |
NA
|
| Construction |
243,633 |
223,397 |
217,384 |
266,994 |
312,650 |
319,319 |
269,560 |
-15.6% |
| Manufacturing |
629,296 |
605,159 |
528,377 |
557,095 |
532,466 |
608,034 |
513,370 |
-15.6% |
| Trans,
Comm, Pub Util |
2,572,659 |
2,607,929 |
2,581,062 |
2,873,043 |
3,212,975 |
3,248,197 |
2,884,374 |
-11.2% |
| Wholesale |
2,136,082 |
2,427,493 |
2,538,512 |
2,518,226 |
2,966,252 |
3,320,836 |
3,363,267 |
1.3% |
| Retail |
13,815,206 |
14,899,354 |
15,861,254 |
18,247,283 |
19,762,887 |
21,267,878 |
22,507,854 |
5.8% |
| Finance,
Ins, RE |
751,660 |
814,036 |
923,819 |
1,005,737 |
1,062,609 |
1,153,322 |
1,069,762 |
-7.2% |
| Services |
6,670,510 |
7,086,106 |
7,393,485 |
8,630,174 |
8,976,090 |
9,483,204 |
9,393,640 |
-0.9% |
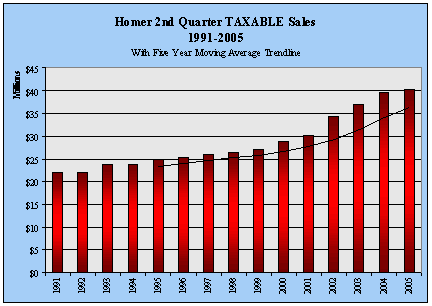
| Government |
26,938,559 |
28,797,872 |
30,191,477 |
34,267,489 |
37,038,468 |
39,648,524 |
40,238,511 |
1.5% |
| Annual
Change |
|
6.9% |
4.8% |
13.5% |
8.1% |
7.0% |
1.5% |
|
|