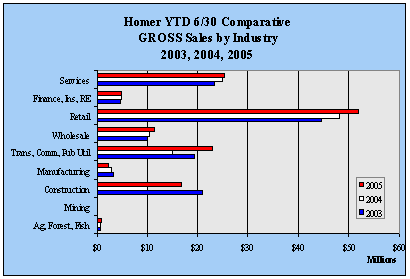
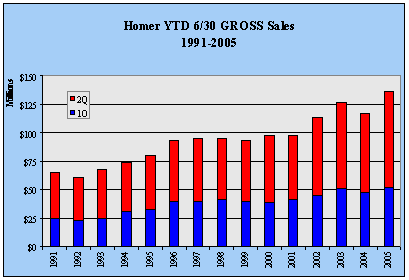
| Homer YTD 6/30
GROSS Sales by Industry - 1999-2005 - in $ |
| |
1999 |
2000 |
2001 |
2002 |
2003 |
2004 |
2005 |
Annual
Change |
| Ag,
Forest, Fish |
391,347 |
790,276 |
381,823 |
385,101 |
669,479 |
659,447 |
790,574 |
19.9% |
| Mining |
195 |
0 |
10,981 |
5,199 |
0 |
360 |
15,410 |
NA
|
| Construction |
11,889,063 |
19,103,934 |
14,850,565 |
15,868,655 |
20,866,561 |
10,011,515 |
16,637,769 |
66.2% |
| Manufacturing |
8,247,806 |
3,692,870 |
2,780,586 |
3,044,255 |
3,217,571 |
2,923,790 |
2,317,787 |
-20.7% |
| Trans,
Comm, Pub Util |
16,553,120 |
16,347,045 |
17,319,824 |
20,766,385 |
19,239,191 |
15,011,559 |
22,934,848 |
52.8% |
| Wholesale |
8,743,545 |
7,629,651 |
8,704,682 |
8,718,142 |
10,137,408 |
10,543,909 |
11,362,217 |
7.8% |
| Retail |
29,615,149 |
32,088,649 |
33,901,273 |
38,764,881 |
44,666,489 |
48,248,833 |
51,994,338 |
7.8% |
| Finance,
Ins, RE |
3,874,889 |
3,133,715 |
3,387,314 |
3,574,314 |
4,537,669 |
4,866,668 |
4,811,448 |
-1.1% |
| Services |
14,109,722 |
14,956,609 |
16,365,405 |
21,809,759 |
23,181,852 |
24,853,313 |
25,317,014 |
1.9% |
| Government |
93,424,836 |
97,742,749 |
97,702,453 |
112,936,691 |
126,516,220 |
117,119,394 |
136,181,405 |
16.3% |
| Annual
Change |
|
4.6% |
0.0% |
15.6% |
12.0% |
-7.4% |
16.3% |
|
|


