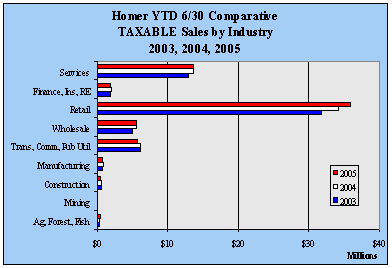
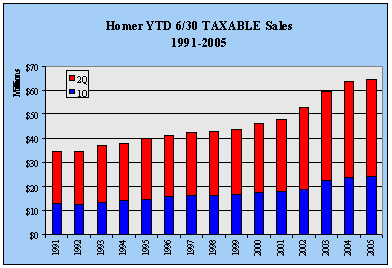
| Homer YTD 6/30
TAXABLE Sales by Industry - 1999-2005 - in $ |
| |
1999 |
2000 |
2001 |
2002 |
2003 |
2004 |
2005 |
Annual
Change |
| Ag,
Forest, Fish |
199,378 |
242,979 |
254,324 |
284,255 |
348,273 |
405,587 |
425,966 |
5.0% |
| Mining |
195 |
0 |
3,189 |
2,665 |
0 |
104 |
0 |
NA
|
| Construction |
425,666 |
438,319 |
396,176 |
504,628 |
555,996 |
596,204 |
507,202 |
-14.9% |
| Manufacturing |
974,329 |
957,392 |
854,252 |
820,347 |
809,992 |
913,385 |
746,149 |
-18.3% |
| Trans,
Comm, Pub Util |
4,873,456 |
4,789,944 |
4,710,712 |
5,098,165 |
6,103,590 |
6,054,703 |
5,704,488 |
-5.8% |
| Wholesale |
3,646,992 |
4,077,191 |
4,230,347 |
4,180,681 |
4,977,060 |
5,555,215 |
5,549,183 |
-0.1% |
| Retail |
22,630,880 |
24,087,192 |
25,410,773 |
28,347,971 |
31,761,592 |
34,246,636 |
35,996,898 |
5.1% |
| Finance,
Ins, RE |
1,412,900 |
1,489,607 |
1,615,853 |
1,774,305 |
1,962,755 |
2,043,875 |
1,922,847 |
-5.9% |
| Services |
9,413,230 |
10,043,108 |
10,481,055 |
11,951,576 |
12,975,492 |
13,657,341 |
13,721,957 |
0.5% |
| Government |
0 |
0 |
0 |
0 |
0 |
394 |
0 |
-100.0% |
| Total |
43,577,026 |
46,125,732 |
47,956,681 |
52,964,593 |
59,494,750 |
63,473,050 |
64,574,690 |
1.7% |
| Annual
Change |
|
5.8% |
4.0% |
10.4% |
12.3% |
6.7% |
1.7% |
|
|


