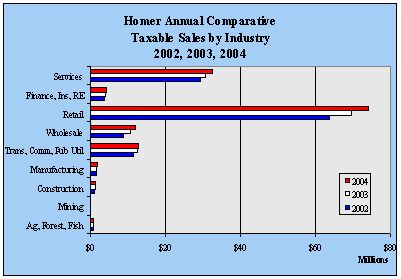
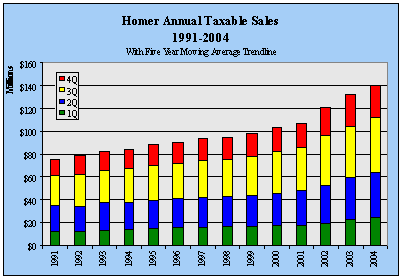
| Homer Annual
TAXABLE Sales by Industry - 1998-2004 - in $ |
| |
1998 |
1999 |
2000 |
2001 |
2002 |
2003 |
2004 |
Annual
Change |
| Ag,
Forest, Fish |
626,058 |
461,892 |
519,595 |
577,360 |
641,294 |
773,421 |
912,356 |
18.0% |
| Mining |
130 |
195 |
1,104 |
5,993 |
2,665 |
347 |
104 |
-70.0% |
| Construction |
820,655 |
891,101 |
891,188 |
940,211 |
1,125,715 |
1,208,909 |
1,182,169 |
-2.2% |
| Manufacturing |
2,087,103 |
2,084,079 |
2,045,894 |
1,769,534 |
1,822,345 |
1,848,166 |
1,857,314 |
0.5% |
| Trans,
Comm, Pub Util |
9,578,082 |
10,137,988 |
10,110,454 |
10,200,922 |
11,698,087 |
12,717,059 |
12,827,427 |
0.9% |
| Wholesale |
7,485,103 |
8,034,552 |
8,633,107 |
8,953,325 |
8,876,648 |
10,611,085 |
11,951,881 |
12.6% |
| Retail |
48,994,370 |
50,357,048 |
53,206,860 |
56,027,806 |
63,864,887 |
69,823,667 |
74,188,687 |
6.3% |
| Finance,
Ins, RE |
2,814,367 |
2,949,461 |
3,147,793 |
3,460,712 |
3,890,685 |
4,074,657 |
4,455,978 |
9.4% |
| Services |
22,035,474 |
23,232,422 |
24,634,121 |
25,375,676 |
29,345,792 |
30,631,264 |
32,626,542 |
6.5% |
| Government |
0 |
0 |
0 |
0 |
0 |
263 |
394 |
49.8% |
| Total |
94,441,342 |
98,148,738 |
103,190,116 |
107,311,539 |
121,268,118 |
131,688,838 |
140,002,852 |
6.3% |
| Annual
Change |
|
3.9% |
5.1% |
4.0% |
13.0% |
8.6% |
6.3% |
|
|


