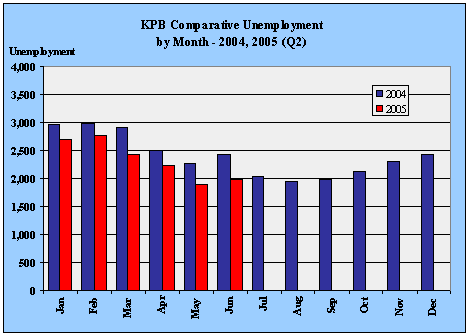
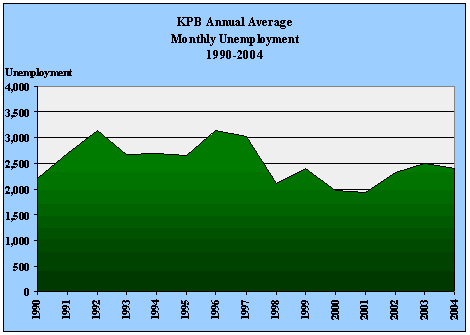
| KPB
Unemployment by Month - 1990-2005 |
| |
Jan |
Feb |
Mar |
Apr |
May |
Jun |
Jul |
Aug |
Sep |
Oct |
Nov |
Dec |
Avg |
| 1990 |
2,680 |
2,704 |
2,484 |
2,300 |
2,072 |
1,938 |
1,671 |
1,768 |
1,929 |
2,374 |
2,325 |
2,317 |
2,214 |
| 1991 |
2,929 |
3,023 |
2,818 |
2,611 |
2,323 |
2,345 |
2,201 |
2,078 |
2,200 |
2,874 |
3,348 |
3,490 |
2,687 |
| 1992 |
4,153 |
4,426 |
3,807 |
3,385 |
3,008 |
3,016 |
2,564 |
2,064 |
2,259 |
2,960 |
2,944 |
3,025 |
3,134 |
| 1993 |
3,596 |
3,823 |
3,357 |
3,014 |
2,494 |
2,439 |
2,004 |
1,769 |
1,752 |
2,503 |
2,603 |
2,660 |
2,668 |
| 1994 |
3,386 |
3,668 |
3,333 |
2,923 |
2,533 |
2,425 |
2,402 |
1,988 |
1,844 |
2,638 |
2,481 |
2,716 |
2,695 |
| 1995 |
3,616 |
3,651 |
3,146 |
2,638 |
2,196 |
2,196 |
2,154 |
1,933 |
1,897 |
2,654 |
2,717 |
2,931 |
2,644 |
| 1996 |
3,791 |
4,034 |
3,447 |
3,164 |
2,872 |
2,680 |
2,544 |
2,207 |
2,676 |
3,214 |
3,484 |
3,512 |
3,135 |
| 1997 |
4,509 |
4,549 |
3,911 |
3,394 |
2,709 |
2,710 |
2,379 |
2,054 |
2,118 |
2,619 |
2,675 |
2,647 |
3,023 |
| 1998 |
3,051 |
3,014 |
2,567 |
2,147 |
1,788 |
1,981 |
1,644 |
1,441 |
1,666 |
2,002 |
1,941 |
2,120 |
2,114 |
| 1999 |
2,779 |
3,247 |
2,779 |
2,420 |
2,097 |
2,119 |
2,026 |
1,942 |
2,076 |
2,317 |
2,430 |
2,549 |
2,398 |
| 2000 |
2,530 |
2,575 |
2,445 |
2,138 |
1,943 |
1,843 |
1,546 |
1,556 |
1,496 |
1,671 |
1,871 |
2,019 |
1,969 |
| 2001 |
2,327 |
2,379 |
2,276 |
2,045 |
1,767 |
1,813 |
1,543 |
1,560 |
1,560 |
1,754 |
1,965 |
2,181 |
1,931 |
| 2002 |
2,503 |
2,518 |
2,542 |
2,335 |
2,117 |
2,207 |
1,981 |
2,007 |
2,092 |
2,247 |
2,466 |
2,690 |
2,309 |
| 2003 |
2,935 |
3,048 |
2,795 |
2,564 |
2,345 |
2,542 |
2,169 |
2,122 |
2,126 |
2,301 |
2,508 |
2,636 |
2,508 |
| 2004 |
2,956 |
2,969 |
2,897 |
2,508 |
2,272 |
2,419 |
2,033 |
1,956 |
1,971 |
2,129 |
2,309 |
2,429 |
2,404 |
| 2005 |
2,690 |
2,763 |
2,431 |
2,227 |
1,891 |
1,983 |
|
|
|
|
|
|
|
|


