| KPB YTD 6/30 GROSS Sales by
INDUSTRY - 1999-2005 - in $ |
| |
1999 |
2000 |
2001 |
2002 |
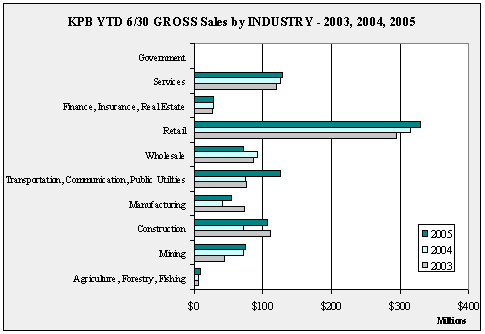
2003 |
2004 |
2005 |
Annual
Change |
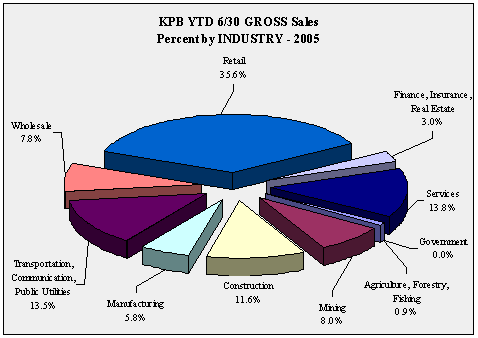
| Agriculture,
Forestry, Fishing |
4,232,629 |
7,324,230 |
4,385,438 |
4,861,344 |
6,065,662 |
6,251,958 |
8,704,051 |
39.2% |
| Mining |
60,073,571 |
46,735,102 |
54,334,306 |
64,523,892 |
44,343,827 |
71,899,741 |
73,796,284 |
2.6% |
| Construction |
62,530,398 |
71,406,342 |
91,223,587 |
93,001,679 |
111,121,384 |
71,026,001 |
106,947,858 |
50.6% |
| Manufacturing |
64,380,550 |
59,515,301 |
105,149,536 |
66,005,209 |
72,836,195 |
41,647,284 |
53,664,885 |
28.9% |
| Transportation,
Communication, Public Utilities |
79,777,691 |
73,792,185 |
78,569,430 |
83,101,571 |
77,059,039 |
74,385,678 |
124,677,770 |
67.6% |
| Wholesale |
69,463,920 |
77,663,421 |
80,077,933 |
83,667,742 |
86,760,176 |
92,413,286 |
72,567,868 |
-21.5% |
| Retail |
243,879,541 |
256,797,055 |
283,285,514 |
281,185,083 |
293,832,344 |
314,556,550 |
329,788,507 |
4.8% |
| Finance,
Insurance, Real Estate |
25,048,139 |
24,323,533 |
24,447,401 |
27,145,915 |
26,979,772 |
27,700,815 |
27,487,194 |
-0.8% |
| Services |
94,089,544 |
100,079,432 |
106,708,416 |
120,655,660 |
119,202,254 |
125,361,273 |
127,422,071 |
1.6% |
| Government |
19,812 |
13,322 |
11,745 |
14,559 |
20,999 |
22,184 |
23,716 |
6.9% |
| Total |
703,495,795 |
717,649,923 |
828,193,306 |
824,162,654 |
838,221,652 |
825,264,770 |
925,080,204 |
12.1% |
| Annual
Change |
|
2.0% |
15.4% |
-0.5% |
1.7% |
-1.5% |
12.1% |
|
|
| KPB
YTD 6/30 GROSS Sales Ten Year Change by INDUSTRY - 1995-2005 - in $ |
| |
|
|
10
Year Change |
| |
1995 |
2005 |
Percentage |
Numerical |
| Agriculture,
Forestry, Fishing |
28,398,555 |
8,704,051 |
-69.4% |
-19,694,504 |
| Mining |
43,366,688 |
73,796,284 |
70.2% |
30,429,596 |
| Construction |
55,679,743 |
106,947,858 |
92.1% |
51,268,115 |
| Manufacturing |
70,268,931 |
53,664,885 |
-23.6% |
-16,604,046 |
| Transportation,
Communication, Public Utilities |
101,996,357 |
124,677,770 |
22.2% |
22,681,413 |
| Wholesale |
54,698,925 |
72,567,868 |
32.7% |
17,868,943 |
| Retail |
192,790,723 |
329,788,507 |
71.1% |
136,997,784 |
| Finance,
Insurance, Real Estate |
20,023,514 |
27,487,194 |
37.3% |
7,463,680 |
| Services |
75,351,139 |
127,422,071 |
69.1% |
52,070,932 |
| Government |
6,033 |
23,716 |
293.1% |
17,683 |
| Total |
642,580,608 |
925,080,204 |
44.0% |
282,499,596 |
|
| KPB
YTD 6/30 GROSS Sales One Year Change by INDUSTRY - 2004-2005 - in $ |
| |
|
|
1
Year Change |
| |
2004 |
2005 |
Percentage |
Numerical |
| Agriculture,
Forestry, Fishing |
6,251,958 |
8,704,051 |
39.2% |
2,452,093 |
| Mining |
71,899,741 |
73,796,284 |
2.6% |
1,896,543 |
| Construction |
71,026,001 |
106,947,858 |
50.6% |
35,921,857 |
| Manufacturing |
41,647,284 |
53,664,885 |
28.9% |
12,017,601 |
| Transportation,
Communication, Public Utilities |
74,385,678 |
124,677,770 |
67.6% |
50,292,092 |
| Wholesale |
92,413,286 |
72,567,868 |
-21.5% |
-19,845,418 |
| Retail |
314,556,550 |
329,788,507 |
4.8% |
15,231,957 |
| Finance,
Insurance, Real Estate |
27,700,815 |
27,487,194 |
-0.8% |
-213,621 |
| Services |
125,361,273 |
127,422,071 |
1.6% |
2,060,798 |
| Government |
22,184 |
23,716 |
6.9% |
1,532 |
| Total |
825,264,770 |
925,080,204 |
12.1% |
99,815,434 |
|