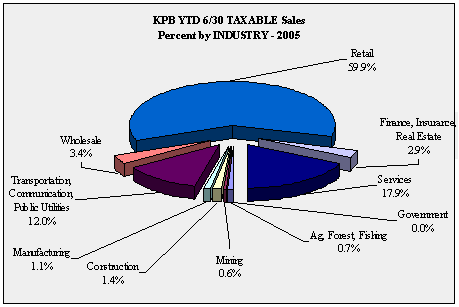
| KPB YTD 6/30 TAXABLE Sales by
INDUSTRY - 1999-2005 - in $ |
| |
1999 |
2000 |
2001 |
2002 |
2003 |
2004 |
2005 |
Annual
Change |
| Ag,
Forest, Fishing |
1,618,223 |
1,903,084 |
2,130,092 |
2,220,368 |
2,340,323 |
2,563,780 |
2,678,251 |
4.5% |
| Mining |
1,701,296 |
1,987,867 |
2,577,296 |
2,966,852 |
2,404,111 |
2,130,172 |
2,115,004 |
-0.7% |
| Construction |
4,372,902 |
4,353,592 |
4,393,270 |
4,714,971 |
5,188,611 |
5,139,211 |
5,115,231 |
-0.5% |
| Manufacturing |
4,087,599 |
4,284,876 |
4,382,690 |
4,099,509 |
4,046,100 |
4,249,831 |
4,022,366 |
-5.4% |
| Transportation,
Communication, Public Utilities |
38,030,469 |
38,357,947 |
38,384,906 |
43,051,137 |
41,971,663 |
40,495,467 |
43,036,143 |
6.3% |
| Wholesale |
8,746,060 |
10,022,041 |
10,400,395 |
10,462,384 |
11,390,544 |
12,492,818 |
12,318,487 |
-1.4% |
| Retail |
160,203,329 |
167,703,226 |
182,360,553 |
186,304,973 |
192,401,051 |
205,540,046 |
215,105,985 |
4.7% |
| Finance,
Insurance, Real Estate |
9,293,864 |
9,458,632 |
10,939,740 |
11,531,092 |
11,284,963 |
10,600,980 |
10,263,709 |
-3.2% |
| Services |
53,943,980 |
56,565,623 |
58,753,041 |
60,292,562 |
60,298,460 |
63,695,410 |
64,286,395 |
0.9% |
| Government |
19,812 |
13,322 |
11,745 |
14,559 |
20,999 |
22,119 |
23,716 |
7.2% |
| Total |
282,017,534 |
294,650,210 |
314,333,728 |
325,658,407 |
331,346,825 |
346,929,834 |
358,965,287 |
3.5% |
| Annual
Change |
|
4.5% |
6.7% |
3.6% |
1.7% |
4.7% |
3.5% |
|
|
| KPB
YTD 6/30 TAXABLE Sales Ten Year Change by INDUSTRY - 1995-2005 - in
$ |
| |
|
|
10
Year Change |
| |
1995 |
2005 |
Percentage |
Numerical |
| Ag,
Forest, Fishing |
1,540,220 |
2,678,251 |
73.9% |
1,138,031 |
| Mining |
2,058,119 |
2,115,004 |
2.8% |
56,885 |
| Construction |
3,701,319 |
5,115,231 |
38.2% |
1,413,912 |
| Manufacturing |
3,677,718 |
4,022,366 |
9.4% |
344,648 |
| Transportation,
Communication, Public Utilities |
32,199,659 |
43,036,143 |
33.7% |
10,836,484 |
| Wholesale |
9,724,367 |
12,318,487 |
26.7% |
2,594,120 |
| Retail |
138,489,301 |
215,105,985 |
55.3% |
76,616,684 |
| Finance,
Insurance, Real Estate |
9,093,252 |
10,263,709 |
12.9% |
1,170,457 |
| Services |
46,365,687 |
64,286,395 |
38.7% |
17,920,708 |
| Government |
6,033 |
23,716 |
293.1% |
17,683 |
| Total |
246,855,675 |
358,965,287 |
45.4% |
112,109,612 |
|
| KPB
YTD 6/30 TAXABLE Sales One Year Change by INDUSTRY - 2004-2005 - in
$ |
| |
|
|
1
Year Change |
| |
2004 |
2005 |
Percentage |
Numerical |
| Ag,
Forest, Fishing |
2,563,780 |
2,678,251 |
4.5% |
114,471 |
| Mining |
2,130,172 |
2,115,004 |
-0.7% |
-15,168 |
| Construction |
5,139,211 |
5,115,231 |
-0.5% |
-23,980 |
| Manufacturing |
4,249,831 |
4,022,366 |
-5.4% |
-227,465 |
| Transportation,
Communication, Public Utilities |
40,495,467 |
43,036,143 |
6.3% |
2,540,676 |
| Wholesale |
12,492,818 |
12,318,487 |
-1.4% |
-174,331 |
| Retail |
205,540,046 |
215,105,985 |
4.7% |
9,565,939 |
| Finance,
Insurance, Real Estate |
10,600,980 |
10,263,709 |
-3.2% |
-337,271 |
| Services |
63,695,410 |
64,286,395 |
0.9% |
590,985 |
| Government |
22,119 |
23,716 |
7.2% |
1,597 |
| Total |
346,929,834 |
358,965,287 |
3.5% |
12,035,453 |
|

