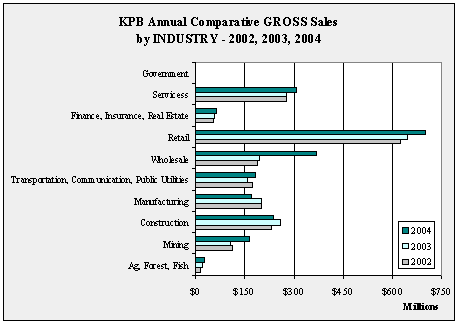
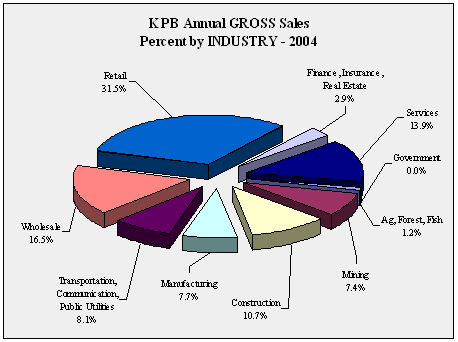
| KPB
Annual GROSS Sales by INDUSTRY - 1998-2004 - in $ |
| |
1998 |
1999 |
2000 |
2001 |
2002 |
2003 |
2004 |
Annual
Change |
| Ag,
Forest, Fish |
30,373,442 |
32,347,943 |
24,816,872 |
17,584,763 |
16,750,059 |
22,009,310 |
27,631,235 |
25.5% |
| Mining |
190,689,442 |
115,241,075 |
121,868,065 |
126,250,792 |
113,521,181 |
106,561,739 |
165,354,111 |
55.2% |
| Construction |
187,102,648 |
166,008,223 |
185,994,582 |
241,706,588 |
229,399,098 |
258,447,580 |
237,489,930 |
-8.1% |
| Manufacturing |
147,360,433 |
165,066,528 |
117,856,947 |
287,725,053 |
201,047,383 |
199,442,339 |
170,708,461 |
-14.4% |
| Transportation,
Communication, Public Utilities |
159,766,641 |
169,321,042 |
156,272,089 |
173,246,581 |
172,554,610 |
158,372,166 |
181,051,679 |
14.3% |
| Wholesale |
149,117,372 |
155,121,630 |
171,235,874 |
177,036,125 |
188,223,387 |
194,212,922 |
366,603,918 |
88.8% |
| Retail |
547,202,550 |
545,752,691 |
580,370,933 |
633,597,773 |
625,008,358 |
644,697,386 |
699,981,425 |
8.6% |
| Finance,
Insurance, Real Estate |
50,782,517 |
51,186,806 |
50,390,903 |
54,153,772 |
54,924,793 |
58,011,247 |
64,300,864 |
10.8% |
| Services |
211,144,805 |
220,251,298 |
235,820,173 |
256,185,223 |
276,510,185 |
278,240,792 |
309,254,338 |
11.1% |
| Government |
26,751 |
28,814 |
17,350 |
20,316 |
22,579 |
41,980 |
35,105 |
-16.4% |
| Total |
1,673,566,601 |
1,620,326,050 |
1,644,643,788 |
1,967,506,986 |
1,877,961,633 |
1,920,037,461 |
2,222,411,066 |
15.7% |
| Annual
Change |
|
-3.2% |
1.5% |
19.6% |
-4.6% |
2.2% |
15.7% |
|
|
| KPB
Annual GROSS Sales Ten Year Change by INDUSTRY - 1994-2004 - in $ |
| |
|
|
10
Year Change |
| |
1994 |
2004 |
Percentage |
Numerical |
| Ag,
Forest, Fish |
68,690,735 |
27,631,235 |
-59.8% |
-41,059,500 |
| Mining |
122,926,355 |
165,354,111 |
34.5% |
42,427,756 |
| Construction |
126,432,113 |
237,489,930 |
87.8% |
111,057,817 |
| Manufacturing |
119,602,870 |
170,708,461 |
42.7% |
51,105,591 |
| Transportation,
Communication, Public Utilities |
215,875,618 |
181,051,679 |
-16.1% |
-34,823,939 |
| Wholesale |
65,326,820 |
366,603,918 |
461.2% |
301,277,098 |
| Retail |
375,876,957 |
699,981,425 |
86.2% |
324,104,468 |
| Finance,
Insurance, Real Estate |
47,089,458 |
64,300,864 |
36.6% |
17,211,406 |
| Services |
149,140,054 |
309,254,338 |
107.4% |
160,114,284 |
| Government |
8,126 |
35,105 |
332.0% |
26,979 |
| Total |
1,290,969,106 |
2,222,411,066 |
72.2% |
931,441,960 |
|
| KPB
Annual GROSS Sales One Year Change by INDUSTRY - 2003-2004 - in $ |
| |
|
|
1
Year Change |
| |
2003 |
2004 |
Percentage |
Numerical |
| Ag,
Forest, Fish |
22,009,310 |
27,631,235 |
25.5% |
5,621,925 |
| Mining |
106,561,739 |
165,354,111 |
55.2% |
58,792,372 |
| Construction |
258,447,580 |
237,489,930 |
-8.1% |
-20,957,650 |
| Manufacturing |
199,442,339 |
170,708,461 |
-14.4% |
-28,733,878 |
| Transportation,
Communication, Public Utilities |
158,372,166 |
181,051,679 |
14.3% |
22,679,513 |
| Wholesale |
194,212,922 |
366,603,918 |
88.8% |
172,390,996 |
| Retail |
644,697,386 |
699,981,425 |
8.6% |
55,284,039 |
| Finance,
Insurance, Real Estate |
58,011,247 |
64,300,864 |
10.8% |
6,289,617 |
| Services |
278,240,792 |
309,254,338 |
11.1% |
31,013,546 |
| Government |
41,980 |
35,105 |
-16.4% |
-6,875 |
| Total |
1,920,037,461 |
2,222,411,066 |
15.7% |
302,373,605 |
|


