| Kenai 2nd Quarter GROSS Sales by
Industry - 1999-2005 - in $ |
| |
1999 |
2000 |
2001 |
2002 |
2003 |
2004 |
2005 |
Annual
Change |
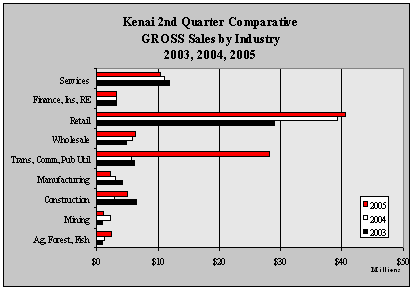
| Ag,
Forestry, Fisheries |
1,270,536 |
3,141,165 |
787,584 |
810,865 |
838,734 |
1,296,885 |
2,360,990 |
82.1% |
| Mining |
64,414 |
1,309,839 |
321,650 |
516,408 |
872,788 |
2,172,358 |
1,068,085 |
-50.8% |
| Construction |
3,454,181 |
2,522,636 |
5,291,031 |
4,295,333 |
6,454,835 |
2,769,875 |
4,994,592 |
80.3% |
| Manufacturing |
1,946,098 |
2,490,501 |
3,567,493 |
3,007,187 |
4,210,293 |
3,062,848 |
2,278,566 |
-25.6% |
| Trans,
Communication, Public Utilities |
6,040,727 |
5,888,108 |
5,834,997 |
6,155,532 |
6,152,058 |
5,560,861 |
28,105,766 |
405.4% |
| Wholesale |
2,623,775 |
4,370,523 |
5,243,400 |
4,677,095 |
4,841,740 |
5,842,357 |
6,386,212 |
9.3% |
| Retail |
35,052,059 |
35,185,697 |
42,832,698 |
34,741,208 |
28,949,996 |
39,251,887 |
40,505,600 |
3.2% |
| Finance,
Ins, Real Estate |
2,725,582 |
2,912,589 |
3,513,695 |
3,667,615 |
3,256,374 |
3,219,231 |
3,116,255 |
-3.2% |
| Services |
8,427,674 |
8,337,449 |
9,281,388 |
10,058,048 |
11,847,481 |
11,099,322 |
10,387,542 |
-6.4% |
| Total |
61,605,046 |
66,158,507 |
76,673,936 |
67,929,291 |
67,424,299 |
74,275,624 |
99,203,608 |
33.6% |
| Annual
Change |
|
7.4% |
15.9% |
-11.4% |
-0.7% |
10.2% |
33.6% |
|
|