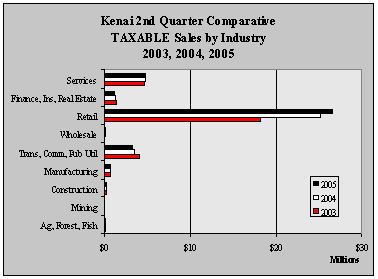
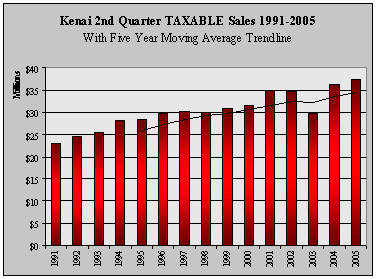
| Kenai 2nd
Quarter TAXABLE Sales by Industry - 1999-2005 - in $ |
| |
1999 |
2000 |
2001 |
2002 |
2003 |
2004 |
2005 |
Annual
Change |
| Ag,
Forest, Fish |
105,339 |
127,041 |
113,069 |
128,556 |
134,783 |
159,363 |
186,963 |
17.3% |
| Mining |
6,684 |
32,572 |
72,568 |
57,479 |
46,723 |
57,575 |
46,396 |
-19.4% |
| Construction |
277,050 |
258,569 |
268,682 |
273,401 |
295,969 |
294,583 |
309,866 |
5.2% |
| Manufacturing |
576,032 |
678,124 |
685,042 |
622,875 |
687,335 |
803,910 |
699,476 |
-13.0% |
| Trans,
Comm, Pub Util |
3,220,508 |
3,448,167 |
3,163,762 |
3,794,883 |
4,056,076 |
3,467,903 |
3,195,056 |
-7.9% |
| Wholesale |
206,332 |
246,267 |
206,838 |
146,986 |
111,864 |
127,610 |
126,121 |
-1.2% |
| Retail |
20,456,980 |
20,739,230 |
23,717,206 |
22,876,325 |
18,246,087 |
25,145,460 |
26,623,174 |
5.9% |
| Finance,
Ins, RE |
1,264,393 |
1,319,015 |
1,670,033 |
1,684,226 |
1,494,804 |
1,345,408 |
1,210,927 |
-10.0% |
| Services |
4,791,749 |
4,698,864 |
5,091,469 |
5,064,834 |
4,727,913 |
4,850,846 |
4,882,756 |
0.7% |
| Total |
30,905,067 |
31,547,849 |
34,988,669 |
34,649,565 |
29,801,554 |
36,252,658 |
37,280,735 |
2.8% |
| Annual
Change |
|
2.1% |
10.9% |
-1.0% |
-14.0% |
21.6% |
2.8% |
|
|


