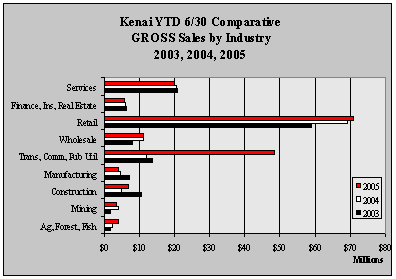
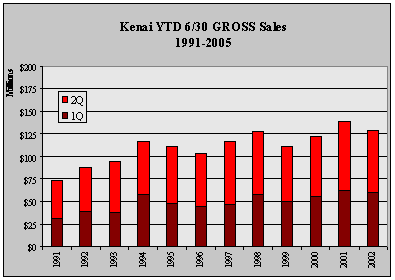
| Kenai
YTD 6/30 GROSS Sales by Industry - 1999-2005 - in $ |
| |
1999 |
2000 |
2001 |
2002 |
2003 |
2004 |
2005 |
Annual
Change |
| Ag,
Forest, Fish |
1,899,646 |
4,431,098 |
1,420,941 |
1,981,179 |
1,841,384 |
2,358,671 |
3,974,543 |
68.5% |
| Mining |
101,890 |
2,847,277 |
1,174,244 |
2,731,125 |
1,815,358 |
4,184,091 |
3,311,706 |
-20.9% |
| Construction |
6,510,071 |
6,201,177 |
7,205,235 |
8,072,404 |
10,570,131 |
5,084,097 |
6,970,106 |
37.1% |
| Manufacturing |
3,421,280 |
4,759,225 |
6,376,411 |
5,263,340 |
7,207,299 |
4,672,870 |
3,978,188 |
-14.9% |
| Trans,
Comm, Pub Util |
12,405,440 |
12,200,687 |
11,913,857 |
12,571,591 |
13,866,427 |
12,049,877 |
48,424,726 |
301.9% |
| Wholesale |
4,536,478 |
7,093,957 |
10,231,346 |
8,041,983 |
8,063,479 |
11,192,139 |
11,360,515 |
1.5% |
| Retail |
62,113,136 |
63,131,221 |
76,982,734 |
63,215,353 |
59,057,226 |
69,066,167 |
71,000,786 |
2.8% |
| Finance,
Ins, Real Estate |
5,375,829 |
5,431,409 |
6,476,043 |
7,106,770 |
6,306,976 |
6,083,904 |
5,743,246 |
-5.6% |
| Services |
14,551,068 |
15,671,832 |
17,311,411 |
19,541,915 |
20,836,376 |
20,656,312 |
19,945,092 |
-3.4% |
| Government |
223 |
256 |
0 |
0 |
0 |
0 |
0 |
NA
|
| Total |
110,914,838 |
121,767,883 |
139,092,222 |
128,525,660 |
129,564,656 |
135,348,128 |
174,708,908 |
29.1% |
| Annual
Change |
|
9.8% |
14.2% |
-7.6% |
0.8% |
4.5% |
29.1% |
|
|


